Observability
Interactive terminal
Workflow failures can be both frustrating and lead to wasted resources as the team seeks to understand what went wrong and why. Dagger's interactive debugging feature is an invaluable tool in this situation.
Dagger lets users drop in to an interactive shell when a workflow run fails, with all the context at the point of failure. This is similar to a debugger experience, but without needing to set breakpoints explicitly. No changes are required to your code.
Here's an example of a workflow run failing, and Dagger opening an interactive terminal at the point of failure:
- Go
- Python
- TypeScript
- PHP
- Java
package main

import "context"

type MyModule struct{}

func (m *MyModule) Foo(ctx context.Context) (string, error) {
	return dag.Container().
		From("alpine:latest").
		WithExec([]string{"sh", "-c", "echo hello world > /foo"}).
		WithExec([]string{"cat", "/FOO"}). // deliberate error
		Stdout(ctx)
}

// run with dagger call --interactive foo
from dagger import dag, function, object_type


@object_type
class MyModule:
    @function
    async def foo(self) -> str:
        return await (
            dag.container()
            .from_("alpine:latest")
            .with_exec(["sh", "-c", "echo hello world > /foo"])
            .with_exec(["cat", "/FOO"])  # deliberate error
            .stdout()
        )


# run with dagger call --interactive foo
import { dag, object, Directory, Container, func } from "@dagger.io/dagger"

@object()
class MyModule {
  @func()
  async foo(): Promise<string> {
    return await dag
      .container()
      .from("alpine:latest")
      .withExec(["sh", "-c", "echo hello world > /foo"])
      .withExec(["cat", "/FOO"]) // deliberate error
      .stdout()
  }
}

// run with dagger call --interactive foo
<?php

declare(strict_types=1);

namespace DaggerModule;

use Dagger\Attribute\{DaggerObject, DaggerFunction};

use function Dagger\dag;

#[DaggerObject]
class MyModule
{
    #[DaggerFunction]
    public function foo(): string
    {
        return dag()
            ->container()
            ->from('alpine:latest')
            ->withExec(['sh', '-c', 'echo hello world > /foo'])
            ->withExec(['cat', '/FOO']) // deliberate error
            ->stdout();
    }
}
package io.dagger.modules.mymodule;

import static io.dagger.client.Dagger.dag;

import io.dagger.client.exception.DaggerQueryException;
import io.dagger.module.annotation.Function;
import io.dagger.module.annotation.Object;
import java.util.List;
import java.util.concurrent.ExecutionException;

@Object
public class MyModule {
  @Function
  public String foo() throws ExecutionException, DaggerQueryException, InterruptedException {
    return dag().container()
        .from("alpine:latest")
        .withExec(List.of("sh", "-c", "echo hello world > /foo"))
        .withExec(List.of("cat", "/FOO")) // deliberate error
        .stdout();
  }
}

// run with dagger call --interactive foo
See it in action:
Breakpoints
You can also set one or more explicit breakpoints in your workflow, which then starts an interactive terminal session at each breakpoint. This lets you inspect a directory or a container at any point in your workflow run, with all the necessary context available to you.
Here's another example, which opens an interactive terminal at two different points in a workflow run to inspect the built container:
- Go
- Python
- TypeScript
- PHP
- Java
package main

import (
	"context"
	"dagger/my-module/internal/dagger"
)

type MyModule struct{}

func (m *MyModule) Foo(ctx context.Context) *dagger.Container {
	return dag.Container().
		From("alpine:latest").
		Terminal().
		WithExec([]string{"sh", "-c", "echo hello world > /foo"}).
		Terminal()
}
import dagger
from dagger import dag, function, object_type


@object_type
class MyModule:
    @function
    async def foo(self) -> dagger.Container:
        return await (
            dag.container()
            .from_("alpine:latest")
            .terminal()
            .with_exec(["sh", "-c", "echo hello world > /foo"])
            .terminal()
        )
import { dag, object, Directory, Container, func } from "@dagger.io/dagger"

@object()
class MyModule {
  @func()
  async foo(): Container {
    return await dag
      .container()
      .from("alpine:latest")
      .terminal()
      .withExec(["sh", "-c", "echo hello world > /foo"])
      .terminal()
  }
}
<?php

declare(strict_types=1);

namespace DaggerModule;

use Dagger\Attribute\{DaggerObject, DaggerFunction};
use Dagger\Container;

use function Dagger\dag;

#[DaggerObject]
class MyModule
{
    #[DaggerFunction]
    public function foo(): Container
    {
        return dag()
            ->container()
            ->from('alpine:latest')
            ->terminal()
            ->withExec(["sh", "-c", "echo hello world > /foo"])
            ->terminal();
    }
}
package io.dagger.modules.mymodule;

import static io.dagger.client.Dagger.dag;

import io.dagger.client.Container;
import io.dagger.module.annotation.Function;
import io.dagger.module.annotation.Object;
import java.util.List;

@Object
public class MyModule {
  @Function
  public Container foo() {
    return dag().container()
        .from("alpine:latest")
        .terminal()
        .withExec(List.of("sh", "-c", "echo hello world > /foo"))
        .terminal();
  }
}
See it in action:
Visualization
Dagger works by building up a DAG of operations and evaluating them, often in parallel. By nature, this is a difficult thing to display. It's easy to show the output of one operation at a time, but as soon as you have parallelism, you'll get jumbled output that's hard to understand.
This quickly creates the need to visualize your workflows to understand and measure what's going on. Dagger includes two features for this purpose - a Terminal UI and Dagger Cloud's Traces.
Terminal UI
The Dagger CLI includes a real-time visualization feature called the terminal UI (TUI). It shows a full-blown DAG in a style similar to git log --graph, with the current state of your DAG's evaluation and a full snapshot of all output at the end.
Rapid iteration
The TUI is designed for rapid iteration, in the same way regular scripting works: you run a command, it shows live progress, and then leaves all the output in your terminal scrollback.
Here's an example of it in action:
The TUI renders a tree of Dagger API calls, represented as GraphQL queries. A parent-child relationship means that the child call is being made by the parent call.
- A red X or green check indicates whether the call succeeded or failed
- A call's duration is rendered after its name
Errors
Error logs appear at the top, directly below the progress report. In most cases, this tells you exactly what went wrong and where without any extra sleuthing.
Telemetry
The TUI also provides real-time telemetry to give you a complete view of your workflow's performance. It allows you to monitor:
- State and duration: Get visual cues for cached and pending states, and see exactly how long each step of your workflow takes (including accounting for lazy effects installed by a Dagger Function)
- CPU resource usage: Identify when CPU contention occurs, such as when all threads are blocked waiting for CPU access, and diagnose performance bottlenecks related to CPU resource constraints
- Network activity: See how much data is sent and received and track packet drop rates to identify potential bottlenecks in your workflows
- Memory usage: Keep an eye on current and peak memory consumption, helping you optimize resource utilization
The CLI has tiered verbosity: -v, -vv, -vvv (just like curl):
-vkeeps spans visible after they complete, rather than disappearing after a brief pause;-vvreveals internal and encapsulated spans;-vvvreveals sub-100ms spans.
For additional debugging information, add the --debug flag to the dagger call command.
The TUI is driven by OpenTelemetry and is essentially a live-streaming OpenTelemetry trace visualizer. It represents Dagger API calls as OpenTelemetry spans with special metadata. If user code integrates with OpenTelemetry, related spans will appear in the TUI as first-class citizens.
Dagger automatically detects OpenTelemetry resource attributes. By utilizing the standard OTEL_RESOURCE_ATTRIBUTES environment variable, operators can now set custom resource attributes to annotate Traces, providing more detailed and contextual information for monitoring and debugging.
Traces
Dagger Cloud provides Traces, a browser-based interface focused on tracing and debugging Dagger Functions. A Trace represents one invocation of a Dagger Function, run locally or in CI. It contains detailed information about the operations performed by the Dagger Function.
Dagger Cloud is a hosted service to help visualize your workflows in a friendly way. You can create a free account by visiting dagger.cloud.
- Traces provides a UI to debug what went wrong when something fails, focusing on tracing what happened and when it happened
- Traces also helps you optimize your Dagger Functions as you author them, by giving you the detailed step-by-step execution of your workflow and the associated telemetry
This is equally useful for debugging workflows running on a developer's local environment and for workflows in CI environments.
Here's an example of it in action:
This feature can also be used for end-to-end monitoring of agent prompts, tool calls, and even low-level system operations. All agent state changes are observable in real time.
Here's an example of it in action:
OpenTelemetry
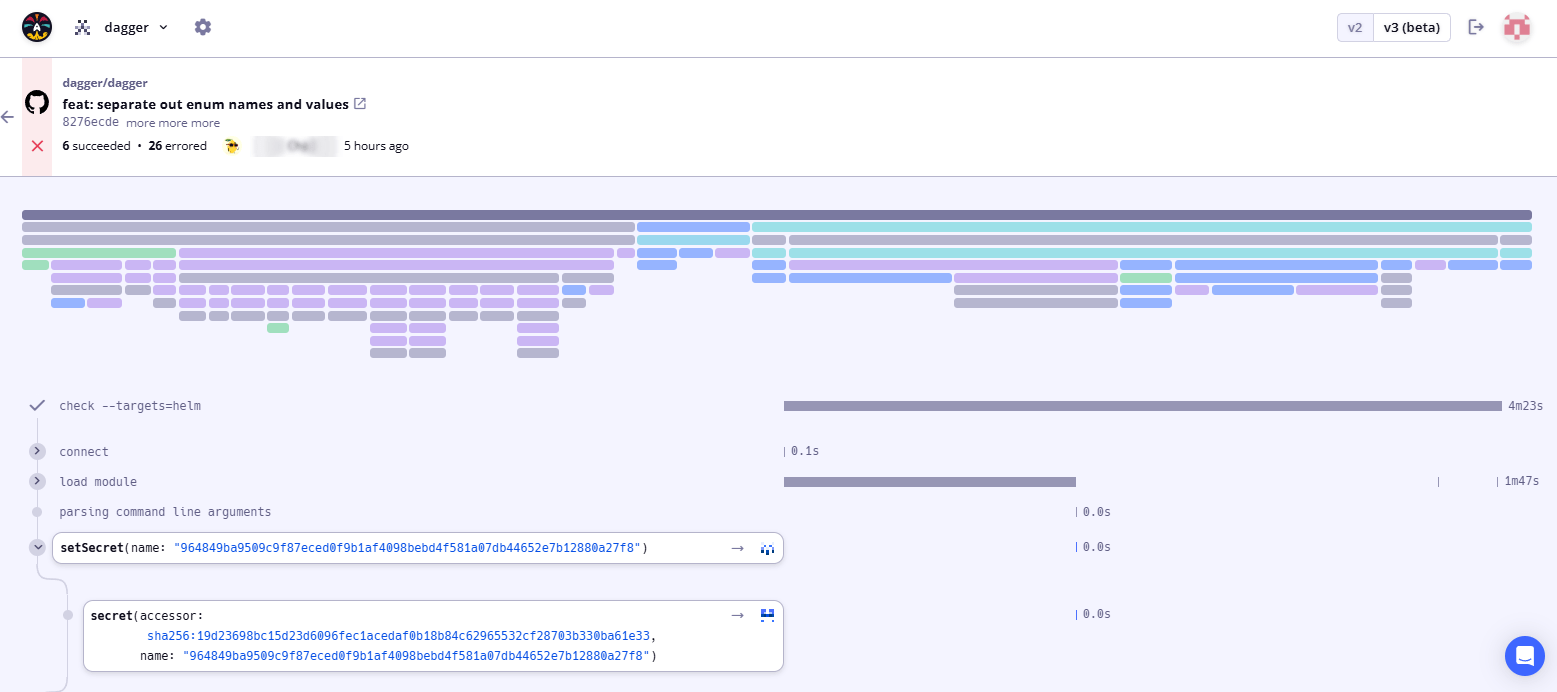
Dagger uses OpenTelemetry (OTel) as its telemetry protocol -- both the TUI and Traces are powered by OTel. Each Dagger Function call is represented as an OpenTelemetry trace. The operations performed by the Dagger Function are represented as OpenTelemetry spans. A span can emit several effects, which are the operations generated in the span. For example, the withDirectory() span generates all the necessary operations to provide a directory with excluded and included elements. For this, it first loads a directory, and then creates a new one from scratch inside the container, generating two distinct steps (effects).
Dagger is aware of the context it runs in. The Dagger Cloud dashboard classifies Traces depending on whether you triggered a run from your local development host or from your CI environment. You can select the appropriate view from the dashboard. Here's an example showing Traces generated in both CI and local environments:
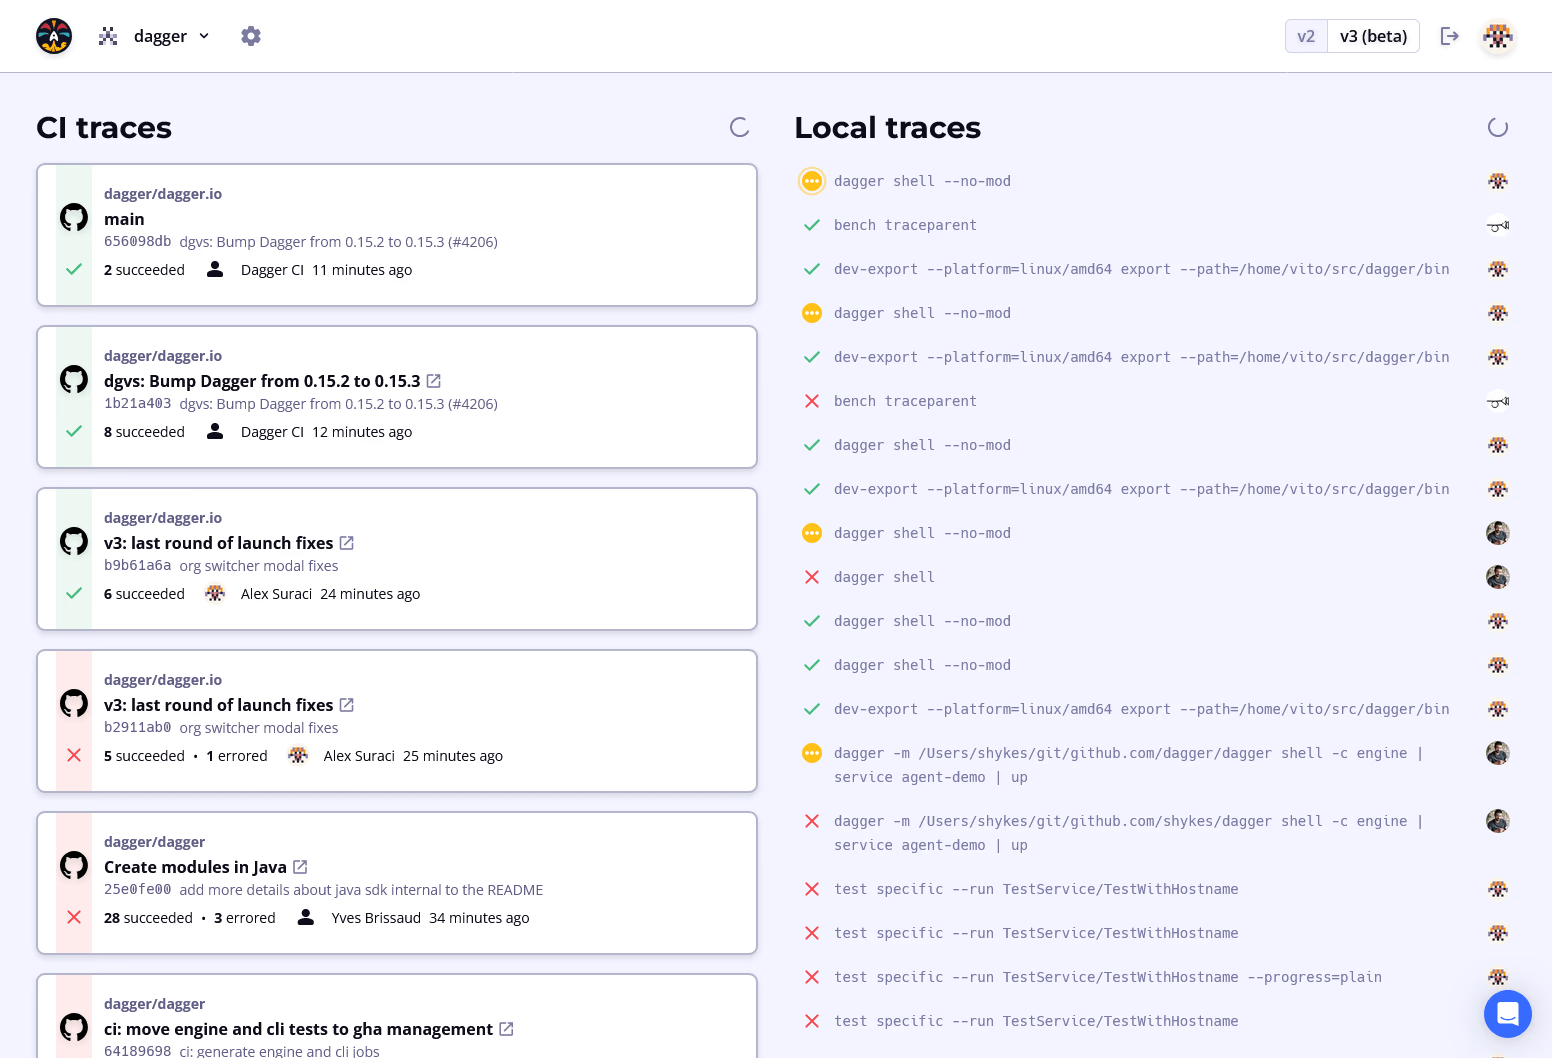
This initial view displays groups of Traces that belong to the same point in Git history. The grouping is determined by the branch/reference combination where Dagger was triggered. This is useful when you need to inspect all the Traces emitted at a specific, pinned point in the repository's version history
Here's a quick summary of what you'll see for each Trace group:
- Repository name
- Commit metadata, including comment and commit author
- Indication of the run status: in progress, succeeded, or failed
- The run start time
All of the information listed above may not be available for a specific group, as it differs depending on whether the Trace is generated by a local run or a CI run. When Dagger runs in a CI environment like GitHub, GitLab, CircleCI, or Jenkins, additional Trace metadata is displayed based on the Git repository information available. Traces that run in CI but contain incomplete or no Git metadata are considered "orphaned" and will not be part of a group.
You can drill down into the details of a specific group by clicking it. This directs you to a timeline view consisting of a list of Traces, together with detailed status and duration metadata for each. Each Dagger Function call is represented as a separate Trace, as shown below:
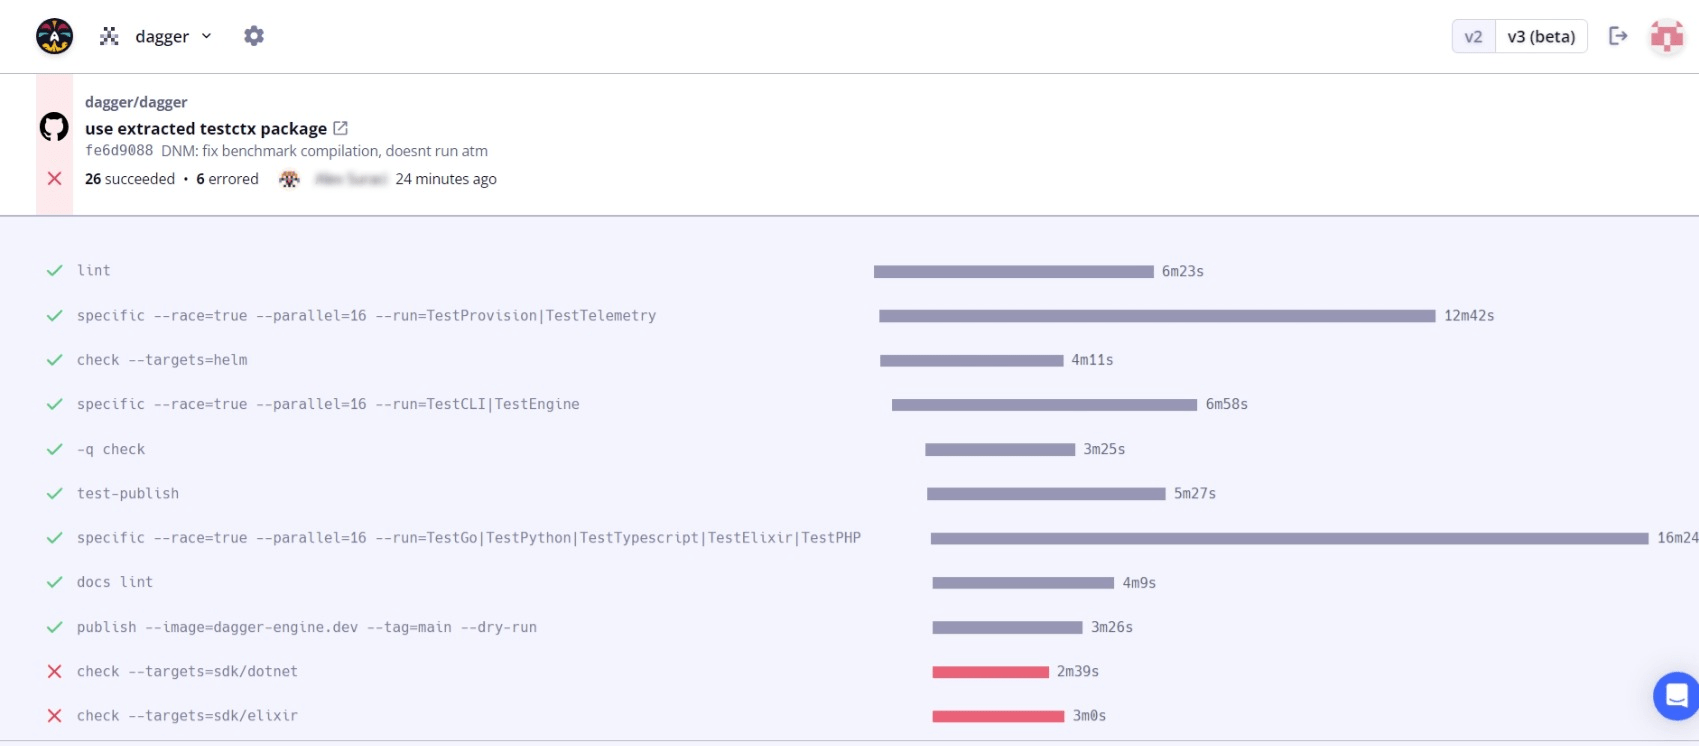
Timeline view
With the timeline view you can view:
- Duration: See exactly how long each Dagger Function in your workflow takes. This helps identify bottlenecks and optimize your workflows for faster execution
- Trace details: See all Traces in a single unified view allowing you to easily drill down into individual Traces to understand their execution
- Failures: Quickly pinpoint failed steps in the timeline and jump to their details immediately
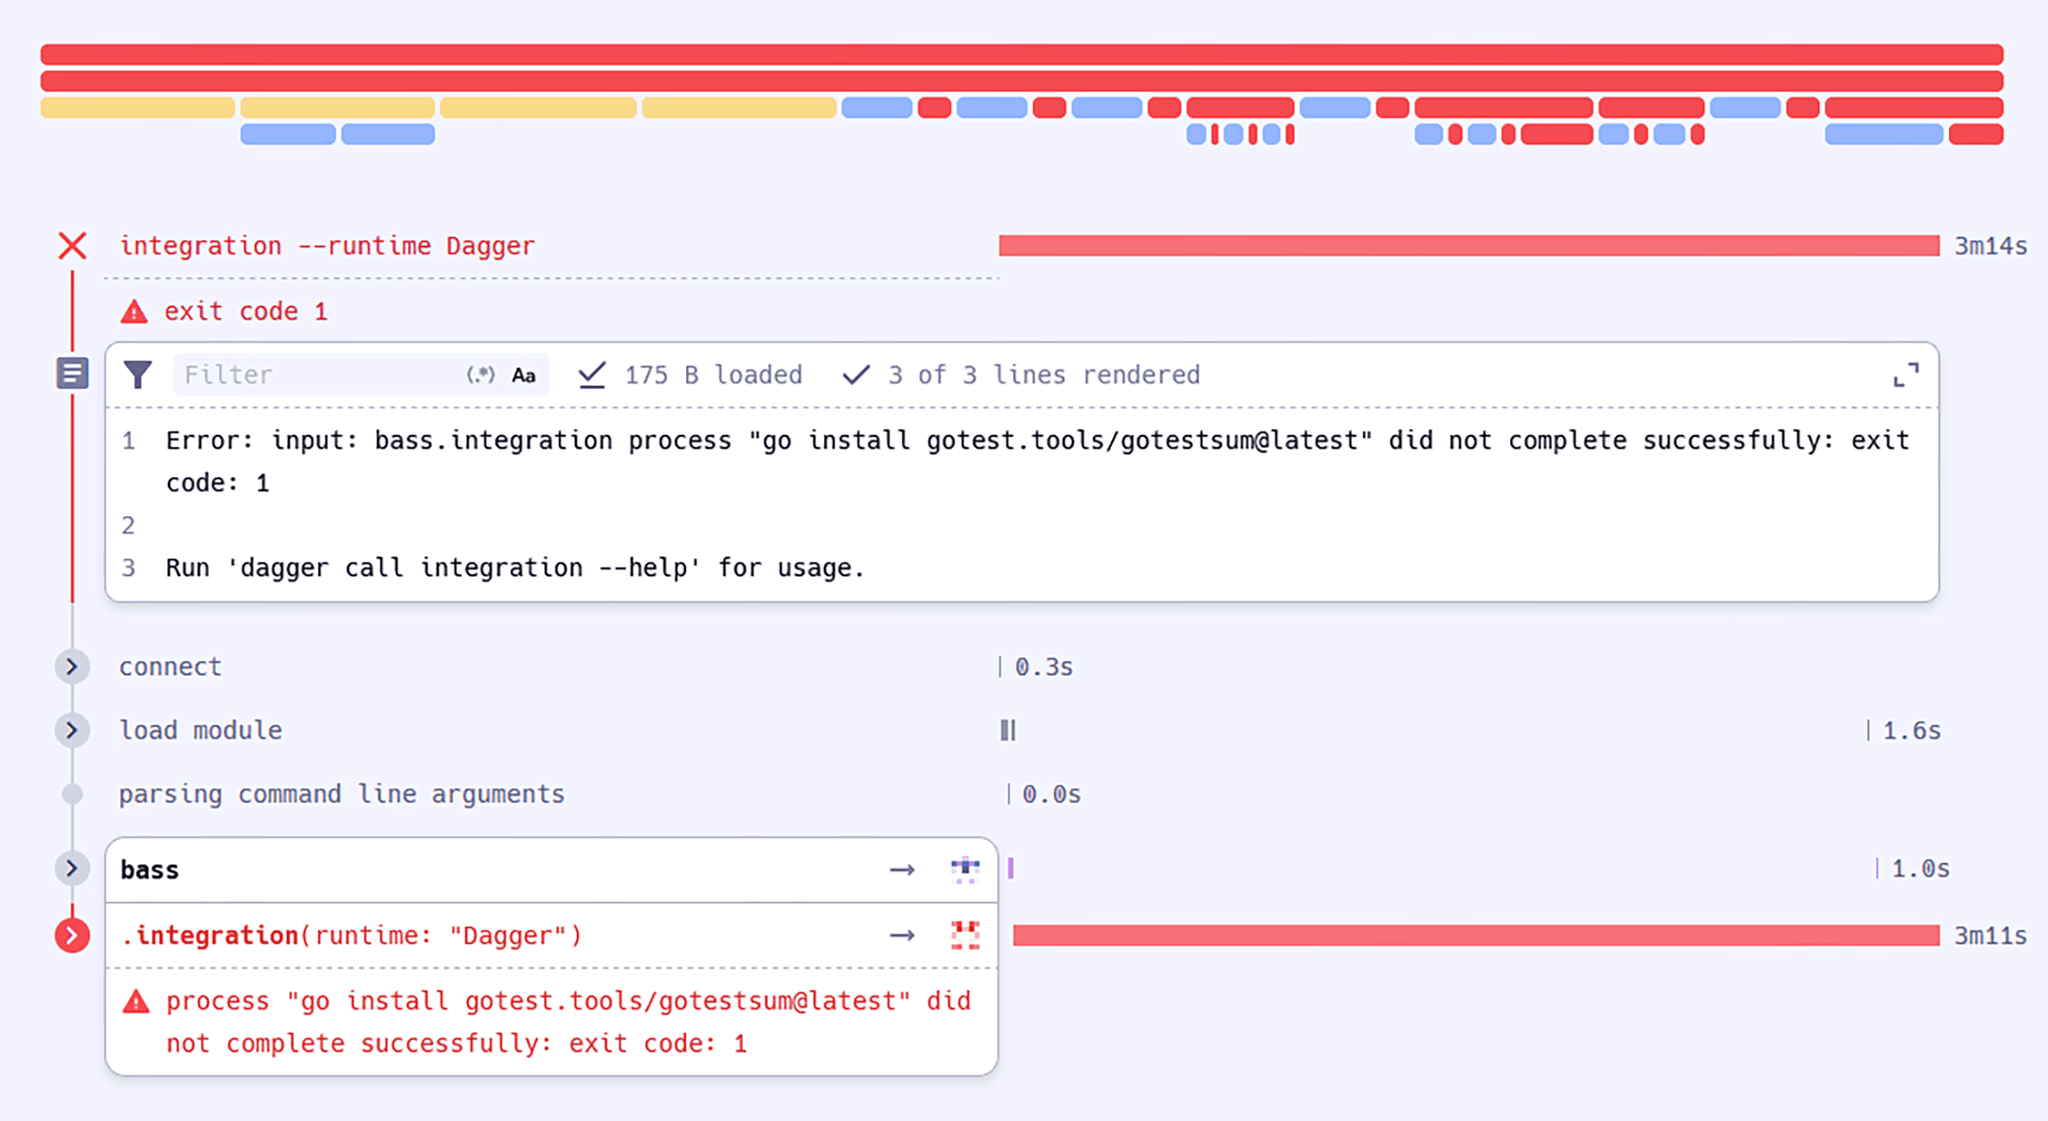
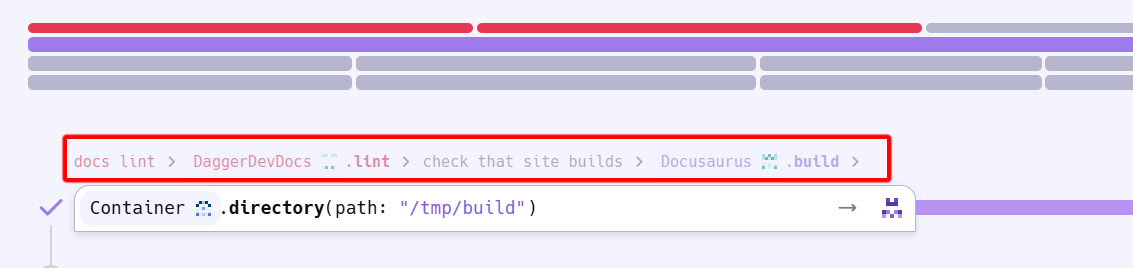
You can click any of the Traces in the list to see detailed logs for each Trace. The flame graph at the top of the Trace shows the operations performed by the Dagger Function, with a visual cue of how much time each operation represents of the total duration, as shown below:
Steps that are currently in progress are highlighted with a blinking or yellow indicator. This gives you a real-time view of your Trace's activity and makes it clear which processes are active. Similarly, if a step has been cancelled, it's displayed with an orange indicator. This helps you quickly distinguish interruptions or cancelled jobs when viewing a Trace.
To make it easier to navigate through Trace logs (some of which can contain thousands of lines), you can quickly search for specific keywords within a Trace log. In addition, breadcrumbs let you see the complete context of any span within the Trace all the way back to the root, allowing you to quickly jump between different parts of the log.
If there are any errors, they are now highlighted in a separate section in the Trace log, making them easier to spot immediately. The error view also provides more context around where and why the issue occurred. This means you can see not just the error, but also the related steps that led up to it.