Dagger Cloud
Dagger Cloud requires a GitHub or Google account for identity verification. If you don't have one, register for a free GitHub account or create a free Google account before proceeding.
Organizations
A Dagger Cloud "organization" refers to a group of member accounts linked to a single team.
A member account grants a person access to log in to a Dagger Cloud organization to diagnose workflow failures and collaborate on changes. Deleting a member of a Dagger Cloud organization will not remove their runs and changes from Dagger Cloud. See Roles and permissions for details on managing members.
Create a Dagger Cloud organization
-
Sign up for Dagger Cloud by selecting a plan on the Dagger website. Dagger Cloud includes plans for both individuals and teams. Click Continue with GitHub to log in with your GitHub account.
-
After authorizing Dagger Cloud for your GitHub account, you'll create your organization. Organization names may contain alphanumeric characters and dashes and are unique across Dagger Cloud. We recommend using your company name or team name for your organization.
-
Review and select a Dagger Cloud subscription plan.
-
If you selected the "Team" plan:
-
You will be presented with the option to add teammates to your Dagger Cloud account. This step is optional and not available in the Individual plan.
-
You will then enter your payment information. After your free 14 day trial completes, you will be automatically subscribed to the Dagger Cloud Team plan.
-
Connect your GitHub account
If you signed up for Dagger Cloud with Google OAuth, you need to link your GitHub account before you can connect repositories.
- Go to Settings > Git Sources.
- Click Connect GitHub to be redirected to GitHub's OAuth authorization page.
- Authorize the Dagger Cloud application.
- You will be redirected back to the Git Sources settings page.
If you signed up with GitHub, your account is already connected.
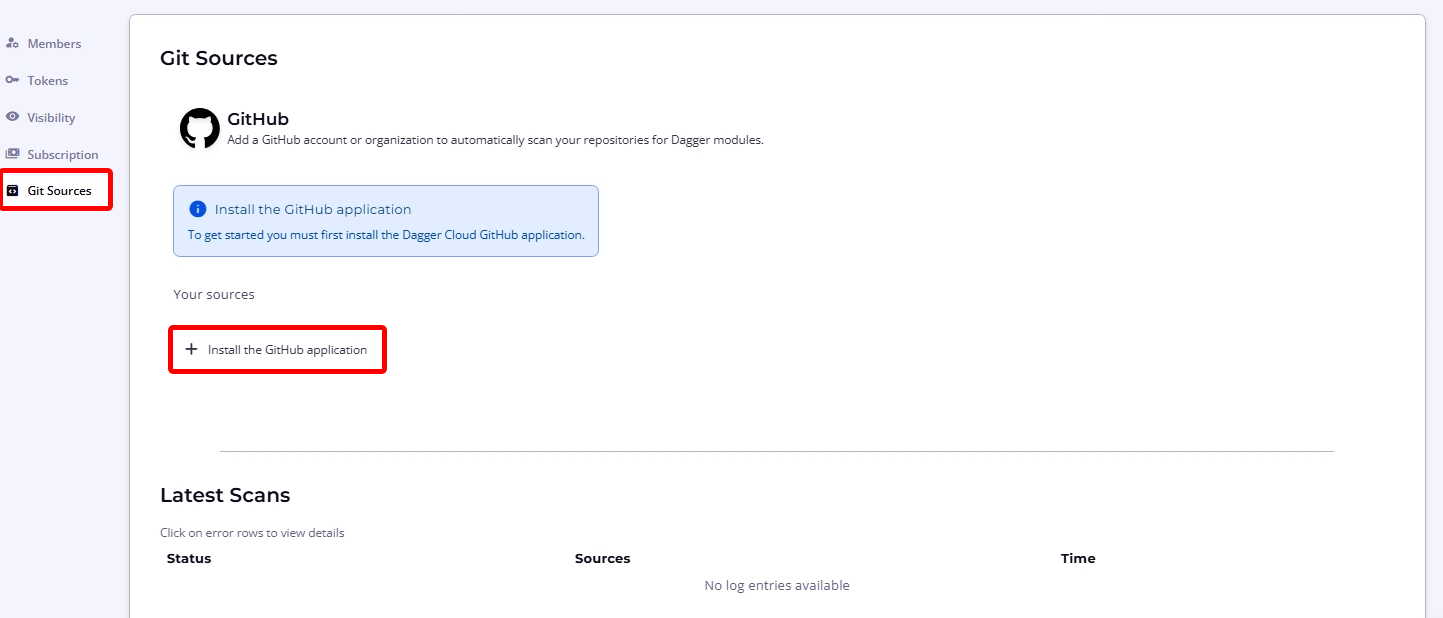
Install the Dagger Cloud GitHub App
The Dagger Cloud GitHub App must be installed on the GitHub organization or user account that owns your repositories.
-
Navigate to the organization settings page using the cogwheel icon in the top navigation bar and select the Git Sources sub-menu.
-
Click Install the GitHub Application to be directed to the GitHub App installation page.
-
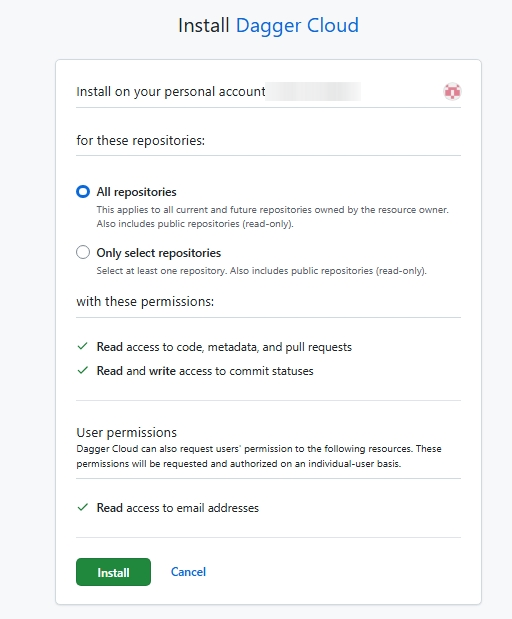
Select the GitHub organization or account you want to connect.
-
Choose which repositories to grant access to — you can select all repositories or specific ones.
-
Confirm the installation.
The app requires the following permissions:
- Commit statuses: Read and write (to report check results)
- Contents: Read-only (to read
dagger.jsonand module source) - Pull requests: Read-only (to respond to PR events)
Checks
Dagger Cloud Checks is a fully managed CI platform with integrated compute and caching. Checks run on Dagger engines fully managed by Dagger — there are no self-hosted runners or infrastructure to maintain. When a commit is pushed, Dagger Cloud detects the event, loads your module, discovers your check functions, runs them on managed infrastructure, and reports results back to GitHub as commit statuses.
Prerequisites
- A Dagger Cloud team account
- A GitHub repository with a Dagger module (
dagger.jsonat the repo root) - The module must define at least one check function
- The Dagger Cloud GitHub App must be installed on the repository's GitHub organization
How checks work
After installing the Dagger Cloud GitHub App, Dagger Cloud monitors your repositories for new commits.
- Push a commit to a connected repository that has a
dagger.json. - Dagger Cloud will:
- Detect the push event via the GitHub webhook
- Load the module from the repository
- Discover all check functions defined in the module
- Run each check on managed infrastructure and report results back to GitHub as commit statuses
You can view check results on the Checks page in Dagger Cloud.
If no checks appear, verify that:
- The repository has a
dagger.jsonat its root - The module defines at least one check function
- The GitHub App is installed on the repository's organization
- A new commit has been pushed (Dagger Cloud only runs checks on new events)
Configure CI secrets
If your checks need access to secrets (API keys, cloud credentials, etc.), you can configure environment variables and secret providers.
Environment variables
- Navigate to a module's settings (click the settings icon next to the module name on the Checks page).
- Add environment variables that should be available to your checks.
- These are injected as a
.envfile in the check's working directory. Read more at Local Defaults (.env) about how to configure default argument values and secrets with environment variables.
Secret providers
Secret providers allow checks to access secrets from external secret managers. To configure a secret provider:
- Go to Settings > CI.
- Expand the provider you want to configure.
- Fill in the required credentials for the provider (see provider-specific sections below).
- Under Linked Modules, select which modules should have access to this provider.
- Click Save.
The following providers are available:
AWS
To use static AWS credentials, create an IAM user with the permissions your checks need, then enter the following in the Dagger Cloud provider configuration:
- AWS_REGION: The AWS region to use (e.g.
us-east-1) - AWS_ACCESS_KEY_ID: The access key ID for your IAM user
- AWS_SECRET_ACCESS_KEY: The secret access key for your IAM user
AWS (OIDC)
OIDC federation lets Dagger Cloud access AWS resources without storing long-lived credentials. Instead, Dagger Cloud mints short-lived tokens that AWS exchanges for temporary credentials.
To set this up, you need to create an OIDC identity provider and an IAM role in your AWS account.
-
Create an OIDC Identity Provider in IAM
Go to IAM > Identity Providers > Add Provider or use the CLI:
aws iam create-open-id-connect-provider \
  --url https://api.dagger.cloud \
  --client-id-list sts.amazonaws.com \
  --thumbprint-list 0000000000000000000000000000000000000000
The thumbprint is required by the API but is no longer used for validation by AWS.
-
Create an IAM Role with a trust policy
Create a trust policy that allows Dagger Cloud to assume the role:
{
  "Version": "2012-10-17",
  "Statement": [
    {
      "Effect": "Allow",
      "Principal": {
        "Federated": "arn:aws:iam::<ACCOUNT_ID>:oidc-provider/api.dagger.cloud"
      },
      "Action": "sts:AssumeRoleWithWebIdentity",
      "Condition": {
        "StringEquals": {
          "api.dagger.cloud:aud": "sts.amazonaws.com"
        }
      }
    }
  ]
}
Create the role:
aws iam create-role \
  --role-name dagger-cloud-checks \
--assume-role-policy-document file://trust-policy.json -
Attach permissions to the role
Grant the role whatever permissions your checks need. For example, to read secrets from AWS Secrets Manager:
aws iam attach-role-policy \
  --role-name dagger-cloud-checks \
  --policy-arn arn:aws:iam::aws:policy/SecretsManagerReadWrite
Or create a more restrictive inline policy:
aws iam put-role-policy \
  --role-name dagger-cloud-checks \
  --policy-name secrets-read \
  --policy-document '{
    "Version": "2012-10-17",
    "Statement": [{
      "Effect": "Allow",
      "Action": "secretsmanager:GetSecretValue",
      "Resource": "arn:aws:secretsmanager:<REGION>:<ACCOUNT_ID>:secret:my-secret-*"
    }]
}' -
Optional: Scope the trust policy
You can restrict which repositories or orgs can assume the role by adding conditions on the
subclaim:{
"Condition": {
"StringEquals": {
"api.dagger.cloud:aud": "sts.amazonaws.com"
},
"StringLike": {
"api.dagger.cloud:sub": "org:*:repo:github.com/myorg/*"
}
}
} -
Configure in Dagger Cloud
Enter the following in the Dagger Cloud AWS (OIDC) provider configuration:
- AWS_ROLE_ARN: The ARN of the IAM role you created (e.g.
arn:aws:iam::<ACCOUNT_ID>:role/dagger-cloud-checks) - AWS_REGION: The AWS region to use (e.g.
us-east-1)
- AWS_ROLE_ARN: The ARN of the IAM role you created (e.g.
GCP (OIDC)
OIDC federation lets Dagger Cloud access GCP resources without storing long-lived credentials. Instead, Dagger Cloud mints short-lived tokens that GCP Workload Identity Federation exchanges for temporary credentials.
To set this up, you need to create a Workload Identity Pool, OIDC provider, and service account in your GCP project.
-
Create a Workload Identity Pool
gcloud iam workload-identity-pools create dagger-cloud \
  --location=global \
--display-name="Dagger Cloud" -
Create an OIDC Provider in the pool
# Get your project number
PROJECT_NUMBER=$(gcloud projects describe $(gcloud config get-value project) \
  --format='value(projectNumber)')

gcloud iam workload-identity-pools providers create-oidc dagger-cloud \
  --location=global \
  --workload-identity-pool=dagger-cloud \
  --issuer-uri=https://api.dagger.cloud \
  --allowed-audiences="//iam.googleapis.com/projects/${PROJECT_NUMBER}/locations/global/workloadIdentityPools/dagger-cloud/providers/dagger-cloud" \
--attribute-mapping="google.subject=assertion.sub" -
Create a Service Account
gcloud iam service-accounts create dagger-cloud-checks \
--display-name="Dagger Cloud Checks" -
Grant the pool permission to impersonate the Service Account
PROJECT_ID=$(gcloud config get-value project)

gcloud iam service-accounts add-iam-policy-binding \
  dagger-cloud-checks@${PROJECT_ID}.iam.gserviceaccount.com \
  --role=roles/iam.workloadIdentityUser \
--member="principalSet://iam.googleapis.com/projects/${PROJECT_NUMBER}/locations/global/workloadIdentityPools/dagger-cloud/*" -
Grant permissions to the Service Account
Grant the service account whatever permissions your checks need. For example, to read secrets from GCP Secret Manager:
gcloud projects add-iam-policy-binding ${PROJECT_ID} \
  --member="serviceAccount:dagger-cloud-checks@${PROJECT_ID}.iam.gserviceaccount.com" \
  --role="roles/secretmanager.secretAccessor"
Or scope it to a specific secret:
gcloud secrets add-iam-policy-binding my-secret \
  --member="serviceAccount:dagger-cloud-checks@${PROJECT_ID}.iam.gserviceaccount.com" \
--role="roles/secretmanager.secretAccessor" -
Optional: Scope access with attribute conditions
You can restrict which repositories or orgs can use the identity pool by adding an attribute condition to the provider:
gcloud iam workload-identity-pools providers update-oidc dagger-cloud \
  --location=global \
  --workload-identity-pool=dagger-cloud \
--attribute-condition="assertion.sub.startsWith('org:MY_ORG_ID:')" -
Configure in Dagger Cloud
Enter the following in the Dagger Cloud GCP (OIDC) provider configuration:
- GCP_WORKLOAD_IDENTITY_PROVIDER: The full provider resource name (e.g.
projects/<PROJECT_NUMBER>/locations/global/workloadIdentityPools/dagger-cloud/providers/dagger-cloud) - GCP_SERVICE_ACCOUNT_EMAIL: The service account email (e.g.
dagger-cloud-checks@<PROJECT_ID>.iam.gserviceaccount.com)
- GCP_WORKLOAD_IDENTITY_PROVIDER: The full provider resource name (e.g.
1Password
To use 1Password as a secret provider, create a 1Password Service Account with access to the vaults your checks need, then enter the following in the Dagger Cloud provider configuration:
- OP_SERVICE_ACCOUNT_TOKEN: The service account token from 1Password
HashiCorp Vault
To use HashiCorp Vault as a secret provider, enter the following in the Dagger Cloud provider configuration:
- VAULT_ADDR: The address of your Vault server (e.g.
https://vault.example.com) - VAULT_TOKEN: A Vault token with access to the secrets your checks need
Optionally, you can also configure AppRole authentication fields if your Vault setup requires them.
Fork PR security
Secrets are never injected for pull requests from forked repositories. This prevents untrusted code from accessing your secrets.
Managing checks
Viewing results
- Checks page: Shows all check runs grouped by repository and commit.
- Check detail view: Click on a specific check to see the full trace visualization.
- GitHub commit statuses: Check results are reported as commit statuses on the repository, visible in pull requests and on commits.
Rerunning checks
Hover over a completed check (success or failure) and click the replay icon to rerun it. Failed load checks (module loading phase) can also be rerun separately.
Cancelling checks
Click the cancel icon on a running or queued check to cancel it. Checks are also automatically cancelled when a newer commit is pushed to the same branch or PR.
Traces
Connect to Dagger Cloud
To visualize traces, connect to Dagger Cloud from your local environment or your CI environment.
Connect from your local environment
You can visualize and debug your local Dagger workflow runs with Dagger Cloud to identify issues before pushing them to CI.
To configure for local development, run the dagger login command. If you have multiple organizations linked to your account, use dagger login ORGANIZATION-NAME instead.
The Dagger CLI will invite you to authenticate your device by displaying a link containing a unique key. Click the link in your browser, and verify that you see the same key in the Dagger Cloud Web interface.
$ dagger login
Browser opened to: https://auth.dagger.cloud/activate?user_code=XXXX-YYYY
Confirmation code: XXXX-YYYY
Once you confirm your authentication code, your Dagger CLI is authenticated and you can visualize and debug your local Dagger workflow runs. Alternatively, you can set your Dagger Cloud token as an environment variable instead of using dagger login:
export DAGGER_CLOUD_TOKEN={your token}
Connect your CI environment
To connect to Dagger Cloud from a CI environment, you need a Dagger Cloud token. Dagger Cloud creates this token automatically when you sign up.
To find your token, navigate to the settings page using the cogwheel icon in the top navigation bar. Under the Tokens sub-menu, click the eye icon to view the token. You can also use this URL pattern: https://dagger.cloud/{Your Org Name}/settings?tab=Tokens
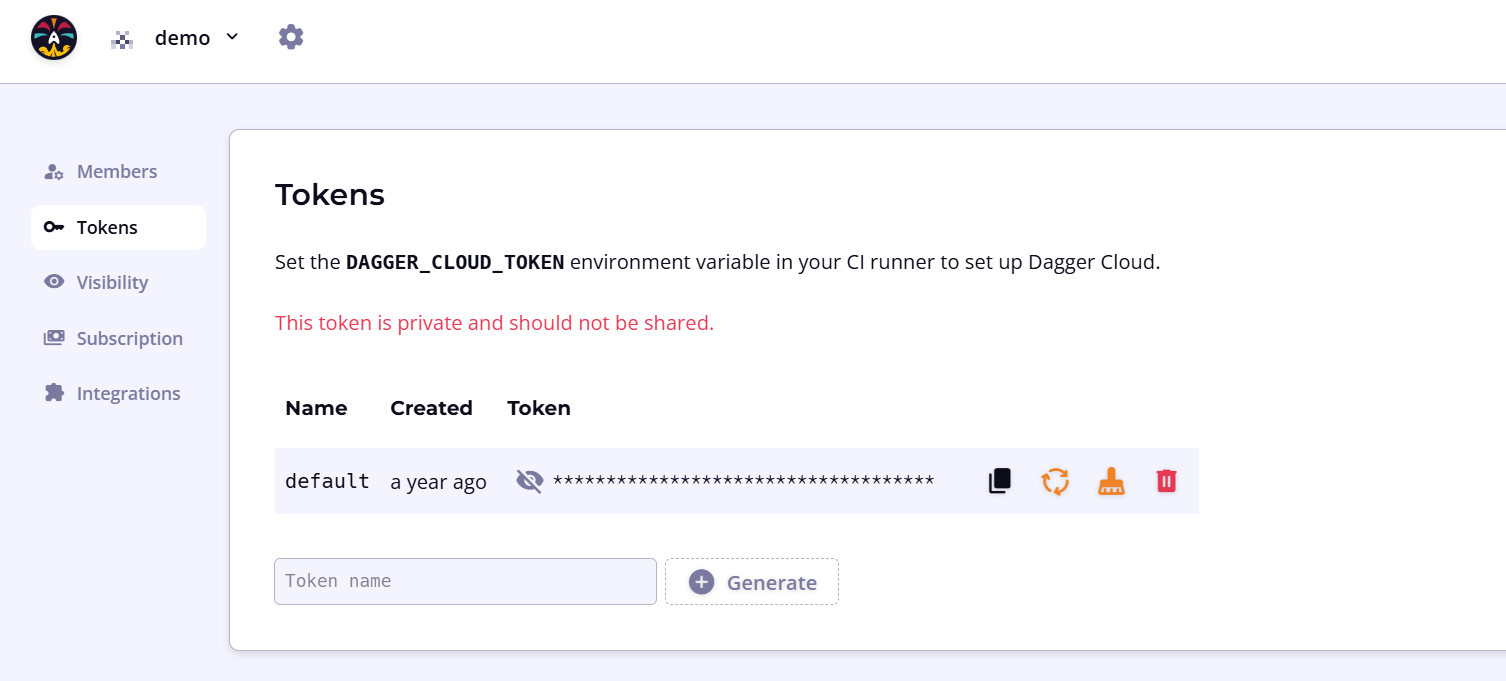
If you regenerate your token, you must replace the token wherever you've referenced it. To reduce operational interruptions, only regenerate your token if it has leaked.
Once you have your token, you can use it to connect Dagger Cloud with your CI environment. The general procedure is:
- Store the Dagger Cloud token as a secret with your CI provider.
- Add the secret to your CI as an environment variable named
DAGGER_CLOUD_TOKEN. - Trigger your CI workflow by pushing a commit or opening a pull request.
You can use Dagger Cloud whether you're hosting your own CI runners and infrastructure or using hosted/SaaS runners.
- GitHub Actions
- GitLab CI
- CircleCI
- Jenkins
- Argo Workflows
-
In your GitHub repository, go to Settings > Secrets and variables > Actions and click New repository secret. Name it
DAGGER_CLOUD_TOKENand set the value to your token. -
Update your GitHub Actions workflow and add the secret to the Dagger workflow step as an environment variable. The environment variable must be named
DAGGER_CLOUD_TOKENand can be referenced in the workflow using the formatDAGGER_CLOUD_TOKEN: ${{ secrets.DAGGER_CLOUD_TOKEN }}. Refer to the GitHub documentation on using secrets in a workflow.
-
In your GitLab project, go to Settings > CI/CD, expand the Variables section, and click Add variable. Name it
DAGGER_CLOUD_TOKEN, set the value to your token, and enable the Mask variable and Protect variable options. -
Update your GitLab CI workflow and add the variable to your CI environment. The environment variable must be named
DAGGER_CLOUD_TOKEN. Refer to the GitLab documentation on using CI/CD variables.
-
In CircleCI, go to your project's Project Settings > Environment Variables and click Add Environment Variable. Name it
DAGGER_CLOUD_TOKENand set the value to your token. -
For GitHub, GitLab or Atlassian Bitbucket source code repositories only: Update your CircleCI workflow and add the following values to the CI environment. Refer to the CircleCI documentation on using pipeline values.
GitHub:
environment:
  CIRCLE_PIPELINE_NUMBER: << pipeline.number >>
GitLab:
environment:
  CIRCLE_PIPELINE_NUMBER: << pipeline.number >>
  CIRCLE_PIPELINE_TRIGGER_LOGIN: << pipeline.trigger_parameters.gitlab.user_username >>
  CIRCLE_PIPELINE_REPO_URL: << pipeline.trigger_parameters.gitlab.repo_url >>
  CIRCLE_PIPELINE_REPO_FULL_NAME: << pipeline.trigger_parameters.gitlab.repo_name >>
Atlassian BitBucket:
environment:
  CIRCLE_PIPELINE_NUMBER: << pipeline.number >>
-
In Jenkins, go to Manage Jenkins > Credentials, select the appropriate scope, and click Add Credentials. Choose Secret text as the kind, set the ID to
DAGGER_CLOUD_TOKEN, and paste your token as the secret. -
Update your Jenkins Pipeline and add the variable to the CI environment. The environment variable must be named
DAGGER_CLOUD_TOKENand can be referenced in the Pipeline environment using the formatDAGGER_CLOUD_TOKEN = credentials('DAGGER_CLOUD_TOKEN'). Refer to the Jenkins documentation on handling credentials.
- This Jenkins Pipeline assumes that the Dagger CLI is pre-installed on the Jenkins runner(s), together with other required dependencies.
- If you use the same Jenkins server for more than one Dagger Cloud organization, create distinct credentials for each organization and link them to their respective Dagger Cloud tokens.
- Typically, Jenkins servers are non-ephemeral and therefore it is not necessary to adjust the
docker stoptimeout.
-
Create a Kubernetes secret named
dagger-cloudcontaining your token. Replace theTOKENplaceholder with your actual token value:kubectl create secret generic dagger-cloud --from-literal=token=TOKEN -
Update your Argo Workflows specification and add the secret as an environment variable. The environment variable must be named
DAGGER_CLOUD_TOKEN.
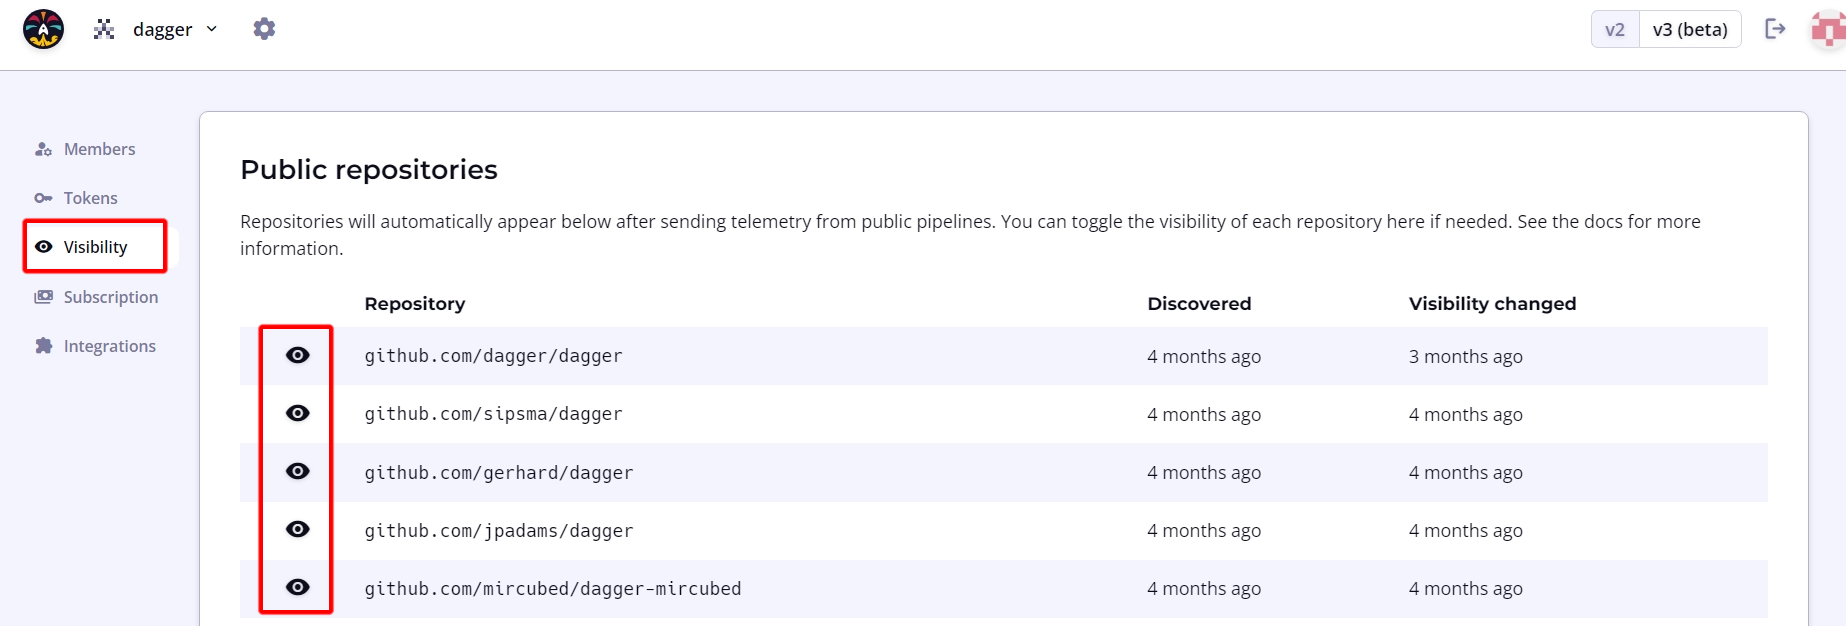
Public traces
Dagger Cloud automatically detects if the traces produced by your workflows originate from a CI system and a public repository. When both conditions are met, Dagger Cloud allows public access to these traces without requiring an invitation to the organization.
To modify this default setting, navigate to the organization page using the cogwheel icon in the top navigation bar. Under the Visibility sub-menu, click the eye icon to toggle public access to trace data as needed.
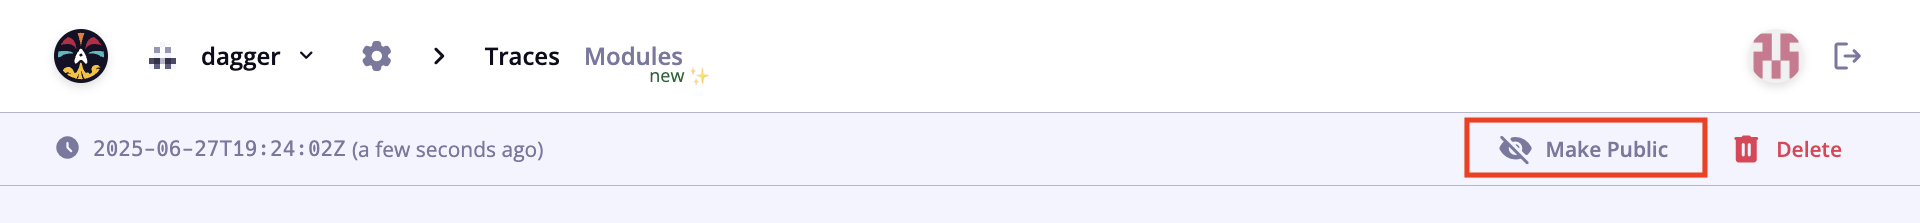
Make an individual trace public
Admin users can make an individual private trace public to share with users outside your organization or who are not yet using Dagger Cloud. A confirmation step verifies your intention, and the action is reversible.
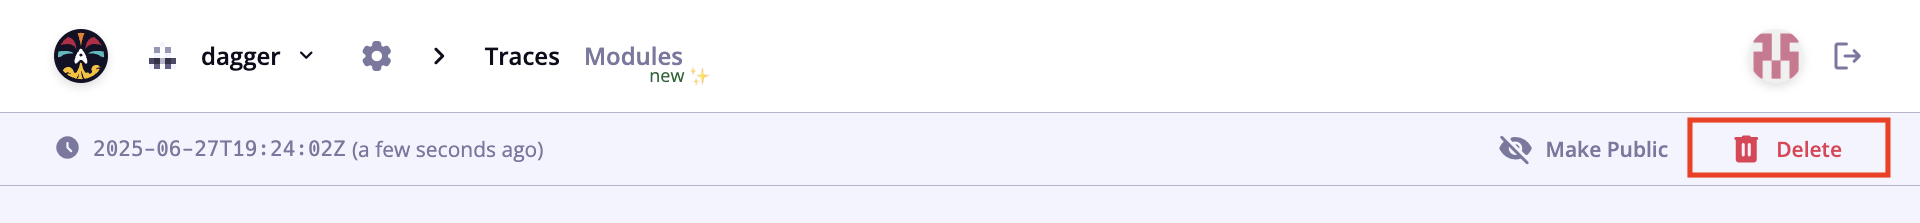
Delete a trace
Admin users can delete an individual trace. A confirmation step verifies your intention, but after deletion the trace is not recoverable.
Modules
Dagger Cloud lets you see all your organization's modules in one place, with metadata like engine versions, descriptions, and linked repositories. Module information and activity is automatically synced from GitHub.
Module scanning
After installing the Dagger Cloud GitHub App, enable module scanning to have Dagger Cloud discover your modules.
-
Go to Settings > Git Sources.
-
Click Enable module scanning for the GitHub organizations you want to scan. You can enable module scanning for multiple GitHub organizations. Each one can be enabled on a single Dagger organization.
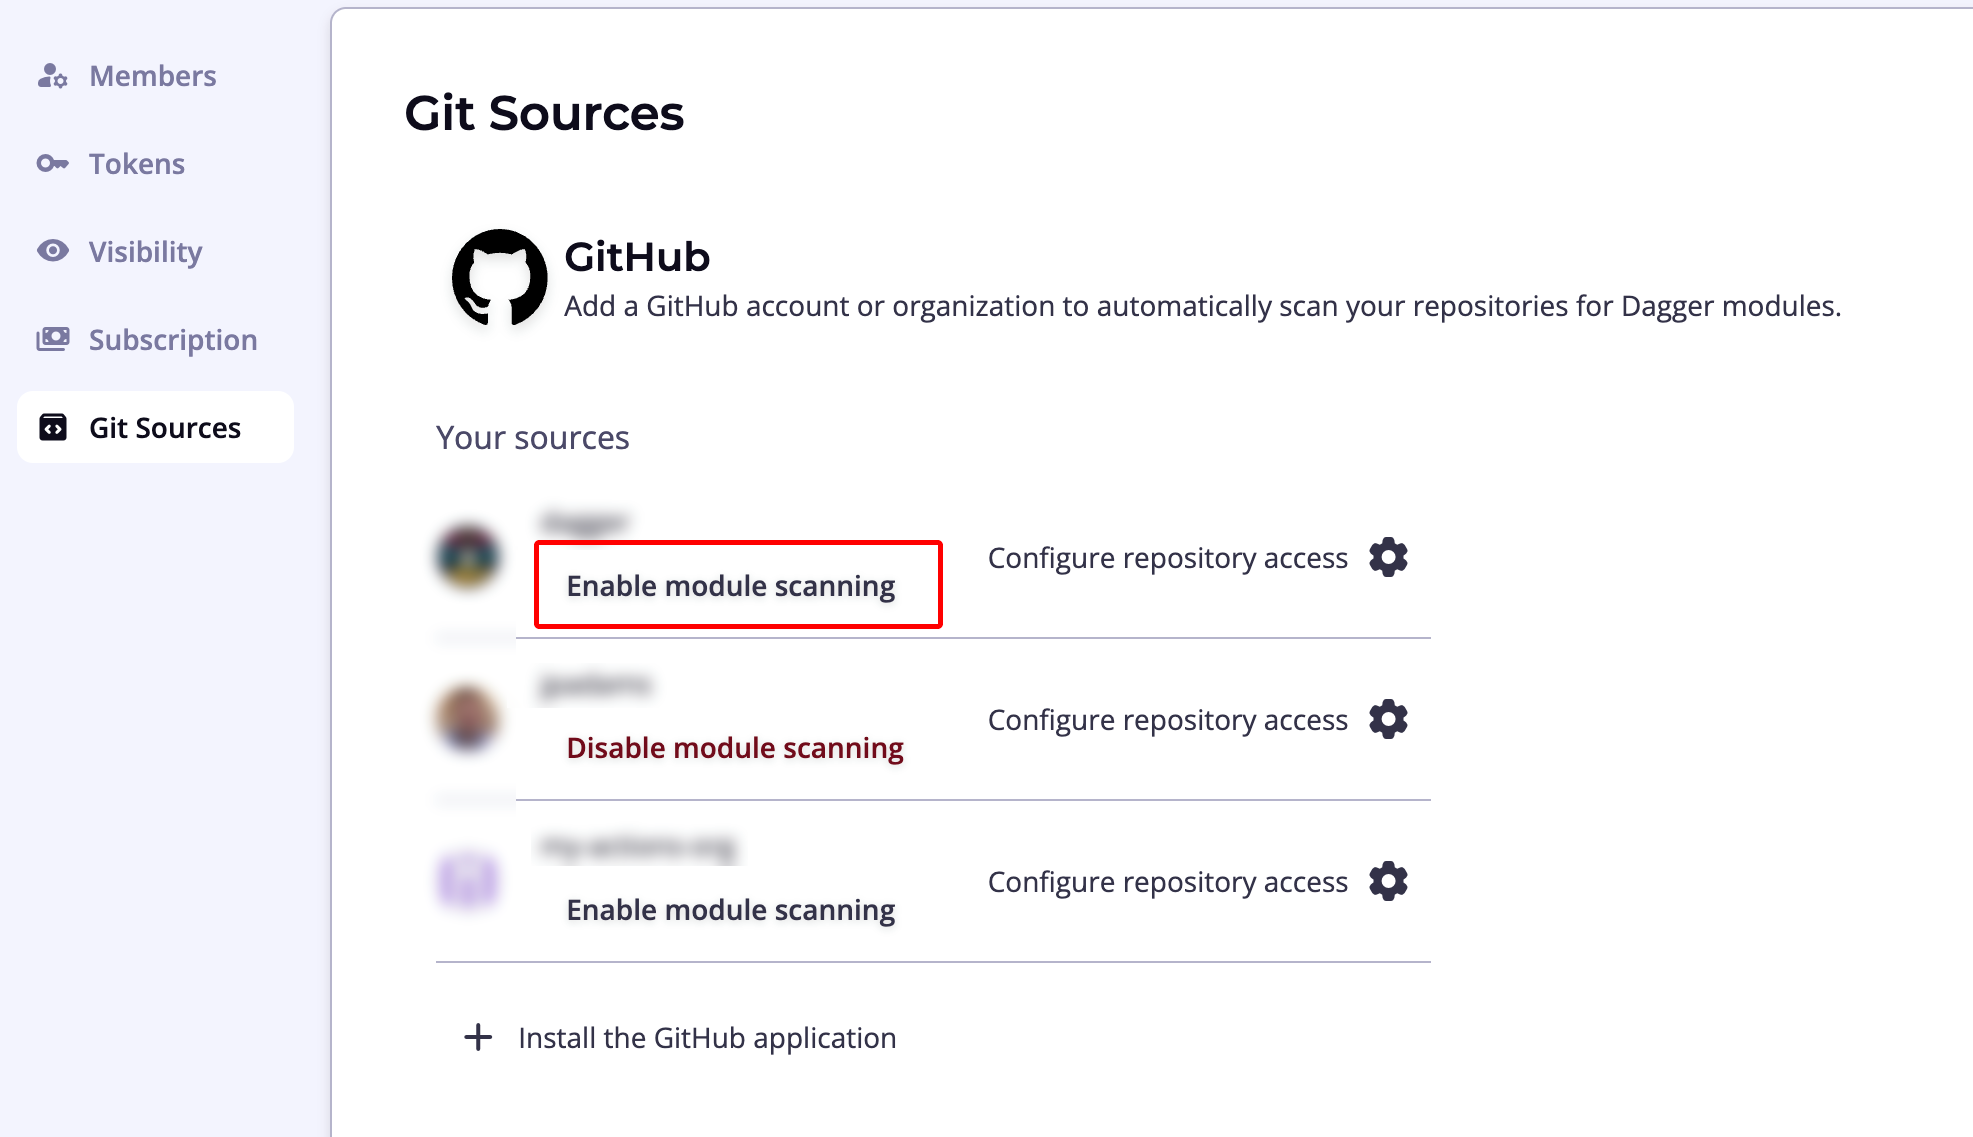
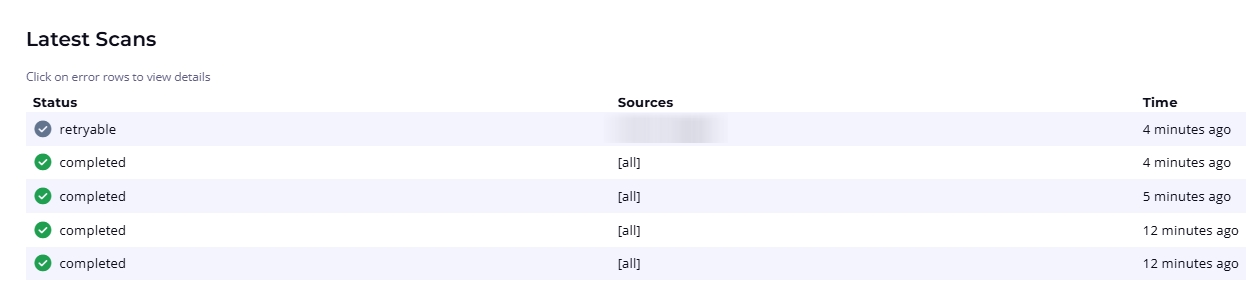
Dagger Cloud will scan your repositories for dagger.json files and discover modules automatically. The Scan Results section at the bottom of the page maintains a record of scans and their status.
Manage and inspect modules
Access the modules dashboard from the Modules menu item in the top navigation bar. You can view all modules in the All Modules tab, or create custom views filtered by team, service, or domain.
Select a module to see detailed information across the following tabs:
- API: View detailed API documentation, including installation command, functions, arguments, and return values
- Activity: See a list of commits sorted by date
- Dependencies: View modules that this module depends on
- Dependents: View modules that depend on this module
- Traces: List traces triggered by the module
Use the version selector in the top bar to switch between versions of a module.
Roles and permissions
In Dagger Cloud, users can have one of two roles: Admin or Member. The Admin role is not a superset of the Member role. If a user needs to administer an organization and view Dagger workflow runs, ensure that the user also has the Member role.
| Actions | Admin | Member |
|---|---|---|
| View Dagger workflow runs and changes | ✓ | |
| View members of an org | ✓ | ✓ |
| Invite new members to an org | ✓ | |
| Delete an existing member from an org | ✓ | |
| Make an individual trace public | ✓ | |
| Delete an individual trace | ✓ |
You cannot change a member's role at this time. Please contact Dagger via the support messenger in Dagger Cloud if you need assistance.
Troubleshooting
No checks appear on the Checks page
- Verify the GitHub App is installed on the repository's organization.
- Push a new commit to trigger a check run — Dagger Cloud only runs checks on new events.
- Check that the repository has a
dagger.jsonat its root.
Checks do not run on a commit
If a commit has merge conflicts with the default branch, checks will not run. Dagger Cloud creates a merge commit to run CI, and it must be able to cleanly merge the branch before running checks. Resolve any merge conflicts and push again.
Checks fail during the load phase
- The module may have syntax errors or missing dependencies.
- Check the trace visualization for detailed error messages.
- Try running the module locally with
dagger checkto reproduce the issue.
Secrets not available in checks
- Verify the secret provider is configured and linked to the correct module.
- The module must have environment variables configured (Settings > module settings).
- Secrets are not injected for fork PRs.
Check results not appearing on GitHub
- Verify the GitHub App has "Commit statuses: Read and write" permission.
- Check that the app is installed on the correct GitHub organization.
OIDC: "Request ARN is invalid" (AWS)
The AWS_ROLE_ARN in Dagger Cloud is not a valid IAM role ARN. It should look like arn:aws:iam::<ACCOUNT_ID>:role/<ROLE_NAME>. Make sure you're using the role ARN, not the OIDC provider ARN.
OIDC: "Access denied" (AWS)
The role was assumed successfully (OIDC is working) but the role doesn't have permission for the action your check is trying to perform. Attach the necessary IAM policies to the role.
OIDC: "Could not assume role" (AWS)
- The OIDC provider in IAM must have the correct issuer URL (
https://api.dagger.cloud). - The trust policy audience must match
sts.amazonaws.com. - The role's trust policy must reference the correct OIDC provider ARN.
OIDC: GCP credential exchange fails
- The Workload Identity Pool OIDC provider must have the correct issuer URI.
- The allowed audience must match the provider resource name.
- The service account must have
roles/iam.workloadIdentityUsergranted to the pool's principal set. - The attribute mapping must include
google.subject=assertion.sub.