Dagger Cloud
Introduction
Dagger Cloud provides pipeline visualization, operational insights, and distributed caching for your Daggerized pipelines.
This guide helps you get started with Dagger Cloud. Here are the steps you'll follow:
- Sign up for Dagger Cloud
- Send telemetry to Dagger Cloud
- Visualize pipeline runs with Dagger Cloud
- Synchronize cache volumes with the Dagger Cloud experimental distributed cache (available on the Team plan)
Dagger Cloud includes plans for both individuals and teams. See more information about the plans.
Prerequisites
- You have an understanding of how Dagger works. If not, read the Dagger Quickstart.
- You have a GitHub account (required for Dagger Cloud identity verification). If not, register for a free GitHub account.
- You have a source code repository and a Dagger Module that interacts with it. If not, fork and locally clone the Dagger source code repository, which you can use with a Go builder module.
Step 1: Sign up for Dagger Cloud
At the end of this step, you will have signed up for Dagger Cloud and obtained a Dagger Cloud token. If you already have a Dagger Cloud account and token, you may skip this step.
Follow the steps below to sign up for Dagger Cloud, create an organization and obtain a Dagger Cloud token.
-
Sign up for Dagger Cloud by selecting a plan on the Dagger website. Click Continue with GitHub to log in with your GitHub account.
-
After authorizing Dagger Cloud for your GitHub account, you'll create your organization.
Naming your organizationOrganization names may contain alphanumeric characters and dashes and are unique across Dagger Cloud. We recommend using your company name or team name for your organization.
-
Review and select a Dagger Cloud subscription plan.
-
If you selected the Team plan:
-
You will be presented with the option to add teammates to your Dagger Cloud account. This step is optional and not available in the Individual plan.
-
You will then enter your payment information. After your free 14 day trial completes, you will be automatically subscribed to the Dagger Cloud Team plan.
-
-
Click Go to dashboard. The next step walks you through how to send telemetry to Dagger Cloud.
Step 2: Connect to Dagger Cloud
At the end of this step, you will have connected Dagger Cloud with your local development environment or with your CI provider or CI tool using your Dagger Cloud token. If you have already connected Dagger Cloud and don't see data yet in your dashboard, skip to the next step.
You can use Dagger Cloud with your CI and for your local development workflows. You instruct your Dagger Engine to connect to Dagger Cloud by referencing your unique Dagger Cloud token. Dagger Cloud creates this token automatically when you sign up.
To find your token, browse to the Organization Settings page, by clicking your profile photo in the left sidebar and then clicking Organization Settings. Select the Configuration tab. You can also use this URL pattern: https://dagger.cloud/{Your Org Name}/settings?tab=configuration
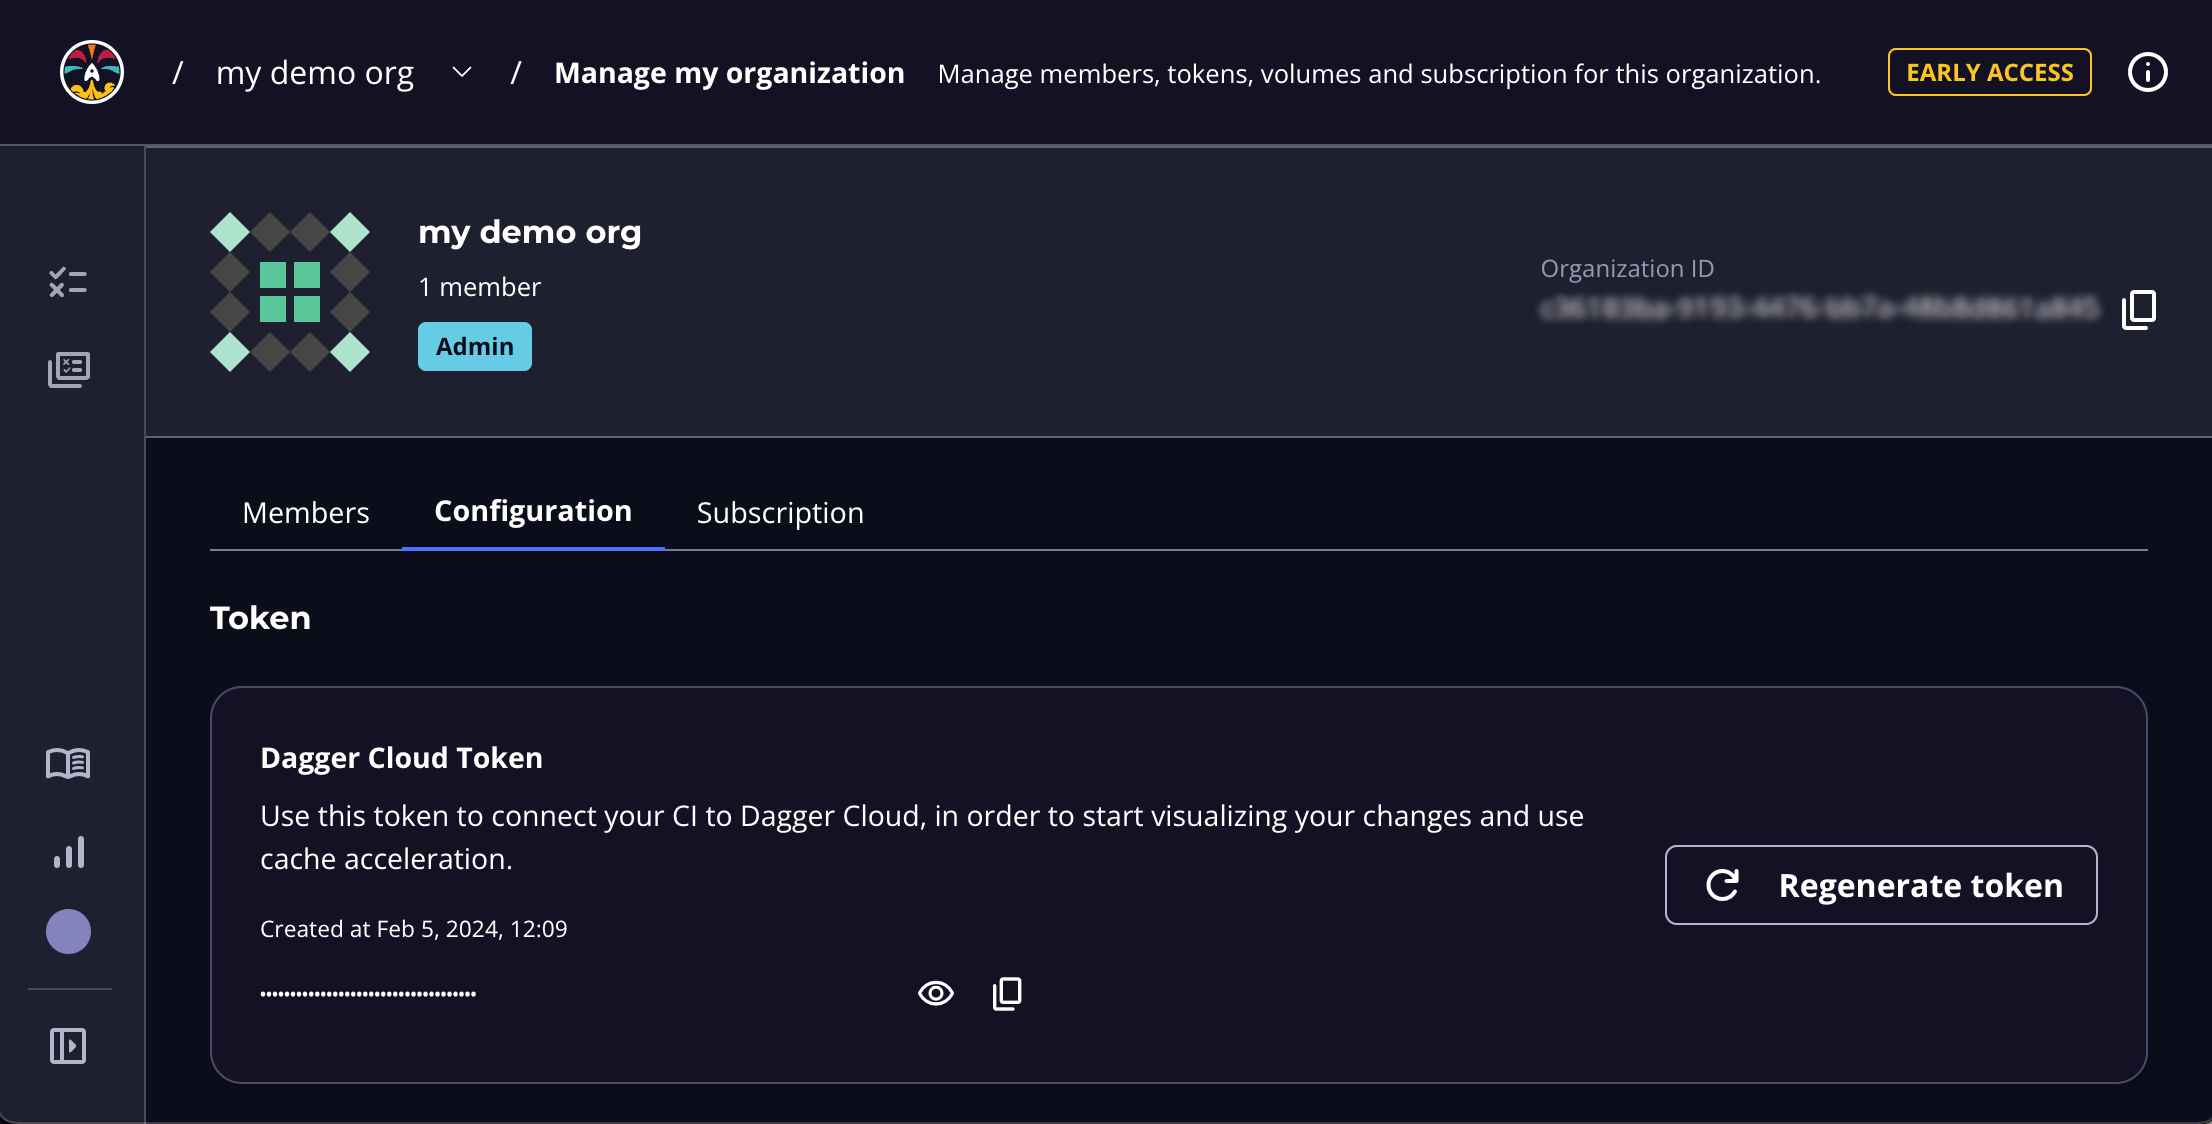
If you regenerate your token, you must replace the token wherever you've referenced it. To reduce operational interruptions, only regenerate your token if it has been leaked.
Once you have your token, you can now use it to connect Dagger Cloud with your CI and/or local development machines.
Connect from your local development host
You can visualize and debug your local Dagger pipeline runs with Dagger Cloud to identify issues before pushing them to CI.
To configure for local development, set your Dagger Cloud token as an environment variable. For example:
export DAGGER_CLOUD_TOKEN={your token}
Connect from your CI engine
The general procedure to connect Dagger Cloud with a CI provider/CI tool is:
- Add your Dagger Cloud token to your CI workflows.
- Store the Dagger Cloud token as a secret with your CI.
Keep your Dagger Cloud token private
You must store the Dagger Cloud token as a secret (not plaintext) with your CI provider and reference it in your CI's workflow. Using a secret is recommended to protect your Dagger Cloud account from being used by forks of your project. We provide links in the steps below for configuring secrets with popular CI tools.
- Add the secret to your CI environment as a variable named
DAGGER_CLOUD_TOKEN.
- Store the Dagger Cloud token as a secret with your CI.
- For Team plan subscribers with ephemeral CI runners only: Add a wait step (example below) for the Docker configuration to allow the Dagger Engine to push cache volumes to the experimental Dagger Cloud distributed cache. Subscribers on the Individual plan do not have access to the experimental distributed cache and do not need to add this step.
- If you are using GitHub Actions, install the Dagger Cloud GitHub app for GitHub Checks. This app adds a GitHub check to your pull requests. Each check links to the corresponding pipeline visualization in Dagger Cloud.
You can use Dagger Cloud whether you're hosting your own CI runners and infrastructure or using hosted/SaaS runners.
When using self-hosted CI runners on AWS infrastructure, NAT Gateways are a common source of unexpected network charges. It's advisable to setup an Amazon S3 Gateway for these cases. Refer to the AWS documentation for detailed information on how to do this.
- GitHub Actions
- GitLab CI
- CircleCI
- Jenkins
- Argo Workflows
-
Create a new secret for your GitHub repository named
DAGGER_CLOUD_TOKEN, and set it to the value of the token obtained in Step 1. Refer to the GitHub documentation on creating repository secrets. -
Update your GitHub Actions workflow and add the secret to the Dagger pipeline step as an environment variable. The environment variable must be named
DAGGER_CLOUD_TOKENand can be referenced in the workflow using the formatDAGGER_CLOUD_TOKEN: ${{ secrets.DAGGER_CLOUD_TOKEN }}. Refer to the GitHub documentation on using secrets in a workflow. -
Install the Dagger Cloud GitHub App. Once installed, GitHub automatically adds a new check for your GitHub pull requests, with a link to see CI status for each workflow job in Dagger Cloud.
-
Create a new CI/CD project variable in your GitLab project named
DAGGER_CLOUD_TOKEN, and set it to the value of the token obtained in Step 1. Ensure that you configure the project variable to be masked and protected. Refer to the GitLab documentation on creating CI/CD project variables and CI/CD variable security. -
Update your GitLab CI workflow and add the variable to your CI environment. The environment variable must be named
DAGGER_CLOUD_TOKEN. Refer to the GitLab documentation on using CI/CD variables. -
For Team plan subscribers with ephemeral CI runners only: Update your GitLab CI workflow (example below) and adjust the
docker stoptimeout period so that Docker waits longer before killing the Dagger Engine container, to give it more time to push data to the Dagger Cloud cache. Refer to the Docker documentation on thedocker stopcommand.
-
Create a new environment variable in your CircleCI project named
DAGGER_CLOUD_TOKENand set it to the value of the token obtained in Step 1. Refer to the CircleCI documentation on creating environment variables for a project. -
For Team plan subscribers with ephemeral CI runners only: Update your CircleCI workflow (example below) and adjust the
docker stoptimeout period so that Docker waits longer before killing the Dagger Engine container, to give it more time to push data to the Dagger Cloud cache. Refer to the Docker documentation on thedocker stopcommand. -
For GitHub, GitLab or Atlassian Bitbucket source code repositories only: Update your CircleCI workflow and add the following pipeline values to the CI environment. Refer to the CircleCI documentation on using pipeline values.
GitHub:
environment:
  CIRCLE_PIPELINE_NUMBER: << pipeline.number >>
GitLab:
environment:
  CIRCLE_PIPELINE_NUMBER: << pipeline.number >>
  CIRCLE_PIPELINE_TRIGGER_LOGIN: << pipeline.trigger_parameters.gitlab.user_username >>
  CIRCLE_PIPELINE_REPO_URL: << pipeline.trigger_parameters.gitlab.repo_url >>
  CIRCLE_PIPELINE_REPO_FULL_NAME: << pipeline.trigger_parameters.gitlab.repo_name >>
Atlassian BitBucket:
environment:
  CIRCLE_PIPELINE_NUMBER: << pipeline.number >>
-
Configure a Jenkins credential named
DAGGER_CLOUD_TOKENand set it to the value of the token obtained in Step 1. Refer to the Jenkins documentation on creating credentials and credential security. -
Update your Jenkins Pipeline and add the variable to the CI environment. The environment variable must be named
DAGGER_CLOUD_TOKENand can be referenced in the Pipeline environment using the formatDAGGER_CLOUD_TOKEN = credentials('DAGGER_CLOUD_TOKEN'). Refer to the Jenkins documentation on handling credentials.
- This Jenkins Pipeline assumes that the Dagger CLI is pre-installed on the Jenkins runner(s), together with other required dependencies.
- If you use the same Jenkins server for more than one Dagger Cloud organization, create distinct credentials for each organization and link them to their respective Dagger Cloud tokens.
- Typically, Jenkins servers are non-ephemeral and therefore it is not necessary to adjust the
docker stoptimeout.
-
Create a new Kubernetes secret named
dagger-cloudand set it to the value of the token obtained in Step 1. An example command to achieve this is shown below (replace theTOKENplaceholder with your actual token value). Refer to the Kubernetes documentation on creating secrets.kubectl create secret generic dagger-cloud --from-literal=token=TOKEN -
Update your Argo Workflows specification and add the secret as an environment variable. The environment variable must be named
DAGGER_CLOUD_TOKEN.
Step 3: Visualize your pipeline runs with Dagger Cloud
At the end of this step, you will have data from one or more CI or local runs available for inspection and debugging in Dagger Cloud.
Trigger runs from your local development host
Before completing these steps, ensure you've added your Dagger Cloud token as an environment variable.
- In your terminal, call the Dagger Module. If your environment variable is properly defined, you will see a Dagger Cloud URL printed in the terminal.
- Click on the URL to view details of the run in Dagger Cloud.
Dagger 0.11.0 adds support for visualizing Dagger functions but does not yet print the Dagger Cloud URL for the pipeline run in the CLI output. We're adding this soon.
To see this in action, commit a change to your forked and locally-cloned Dagger repository and call the Go builder module to build it.
echo "test on local host" >> README.md
git commit -a -m "Updated README"
dagger -m github.com/kpenfound/dagger-modules/golang@v0.1.8 call build --source=. --args=./cmd/dagger
To use Dagger Cloud locally with multiple organizations, you must set distinct environment variables for each organization's Dagger Cloud token. You can find the unique token for an organization in the Organization Settings page.
Trigger runs from your CI engine
Once your CI provider/tool is connected with Dagger Cloud, it's time to test the integration.
To do this, trigger your CI workflow by pushing a commit or opening a pull request. If you are working with a forked and locally-cloned Dagger repository, use the following commands:
echo "test on Dagger Cloud" >> README.md
git commit -a -m "Updated README"
git push
Visualize Dagger pipelines
Dagger 0.11.0 adds support for visualizing Dagger Function calls in Dagger Cloud. With this update, Dagger Cloud will default to use the new Traces views for both dagger call and dagger run commands. Dagger 0.11.0 or later will automatically use the new Traces views. Older versions of Dagger will continue to use the legacy Runs experience.
Traces
Traces is still under development and is in Beta. We welcome your feedback on how we can improve this page. Please join the Dagger Discord to join the Dagger community and share your feedback.
Navigate to the Traces page of the Dagger Cloud dashboard. The Traces page lists runs you've triggered from your local development host or in CI. You should see your most recent Dagger pipeline run as the first entry in the list, as shown below:
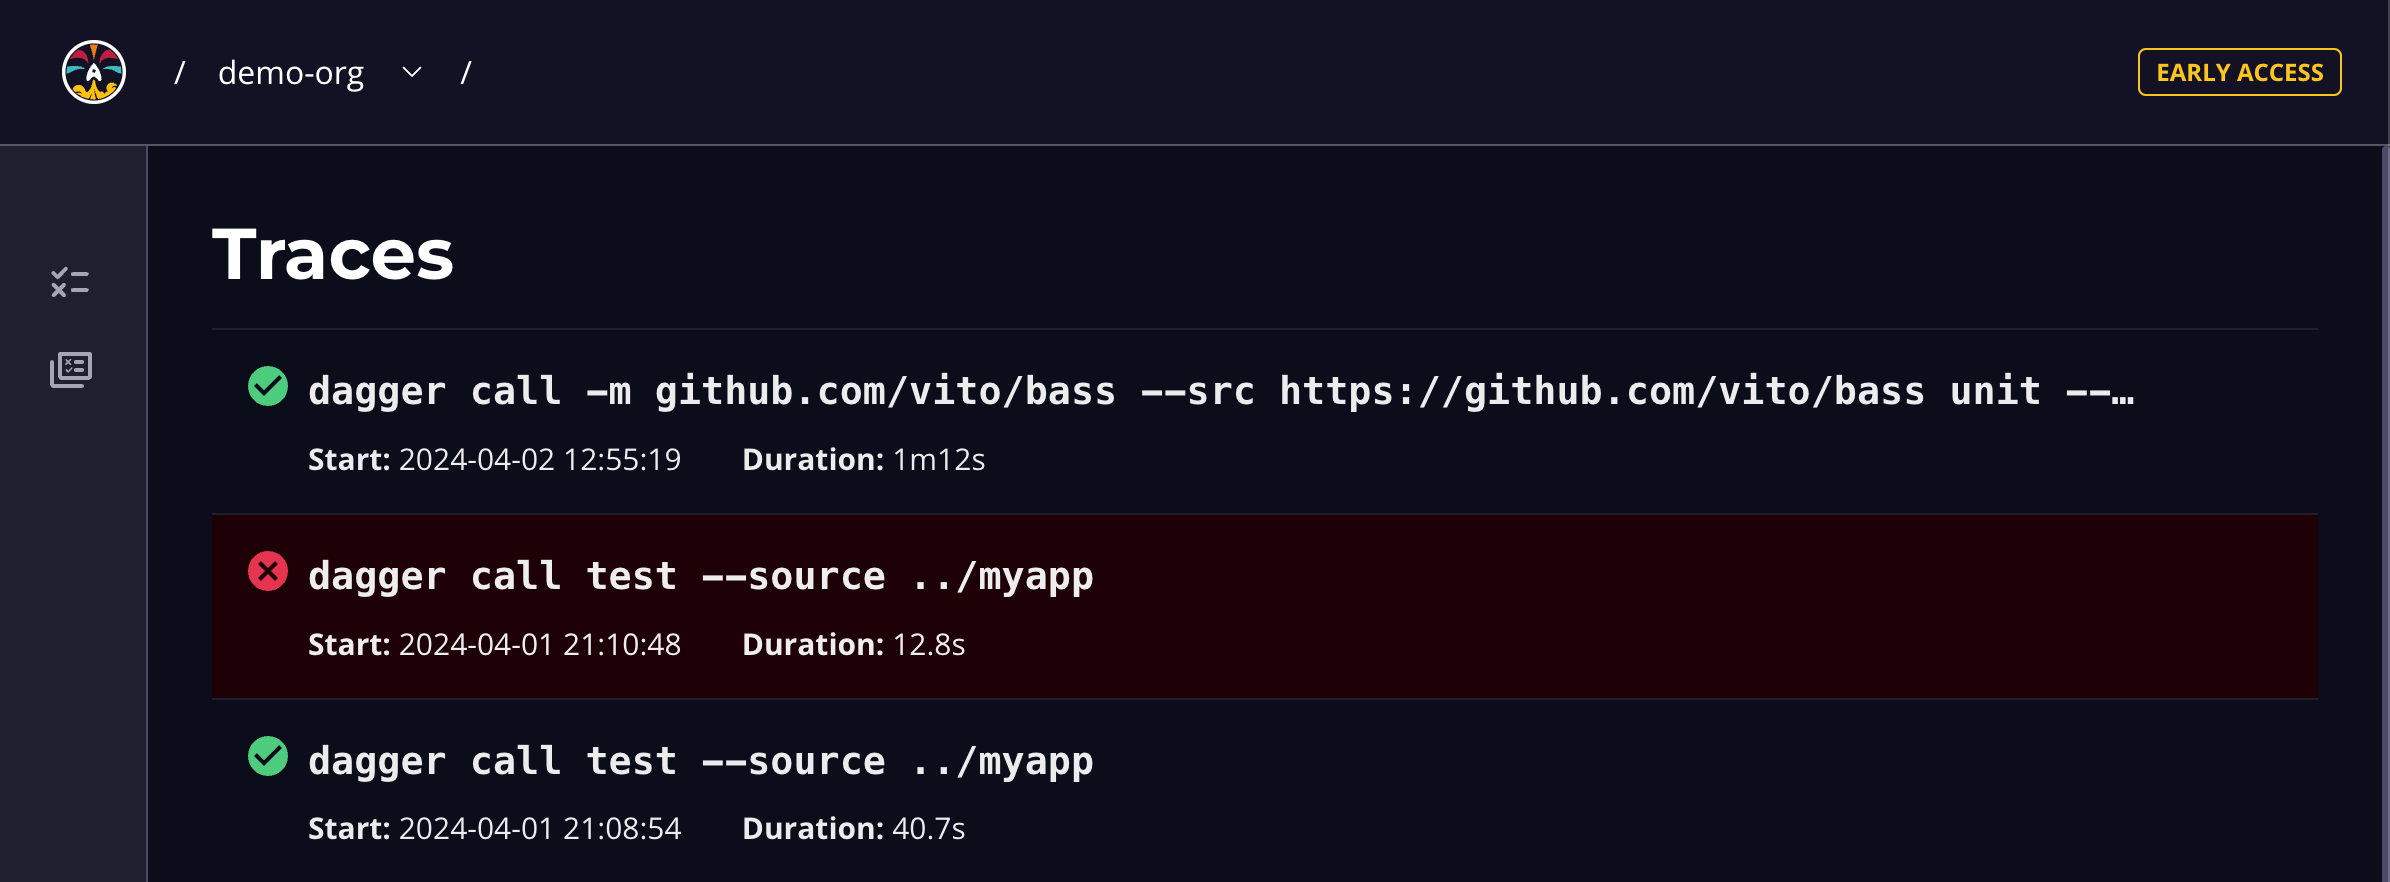
A Trace represents one invocation of a Dagger pipeline, run locally or in CI. It contains detailed information about the steps performed by the pipeline.
The Traces page provides an overview of all Dagger pipeline runs. Here's a quick summary of what you'll see for each trace.
| Field | Description |
|---|---|
| Status icon | Indication of the runs status: in progress, succeeded, or failed |
| Command | The exact command used to invoke your pipeline |
| Start | Run start time |
| Duration | Run duration |
The Traces view does not yet include metadata for the user, branch, remote, or commit. We are working on adding this metadata to the Traces view.
You can drill down into the details of a specific run by clicking it. This directs you to a Trace Details page, as shown below:
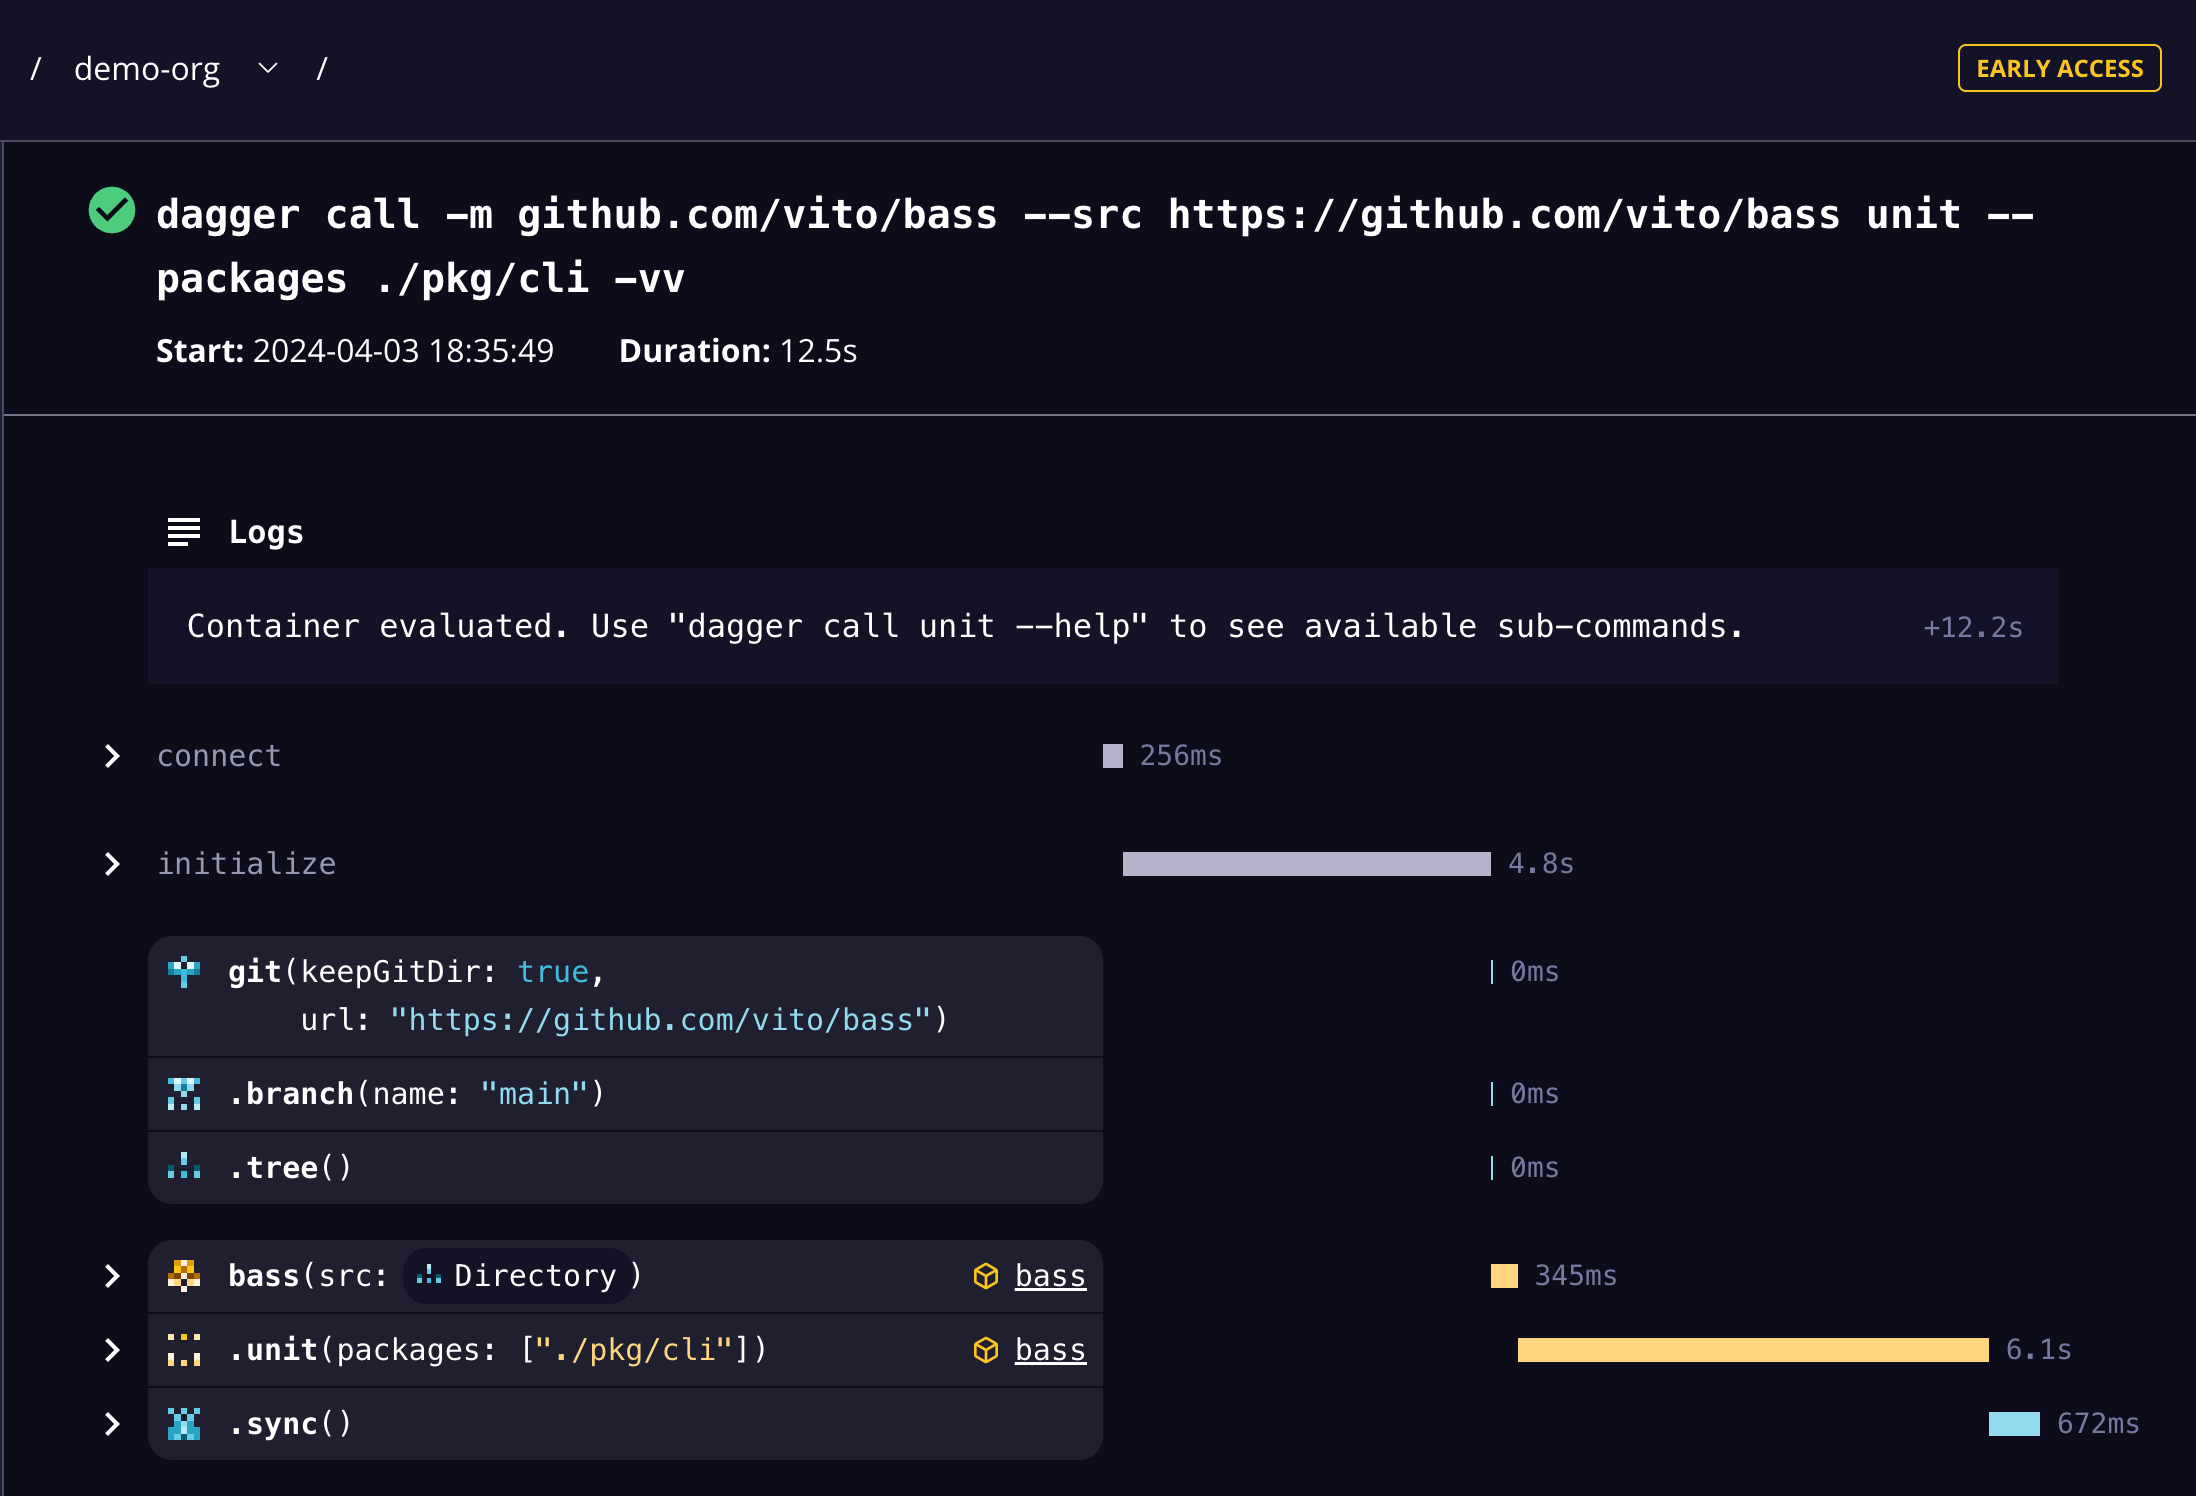
The Trace Details page includes detailed status and duration metadata about the pipeline steps. The tree view shows Dagger pipelines and steps within those pipelines. If there are any errors in the run, Dagger Cloud automatically brings you to the first error in the list. You see detailed logs and output of each step, making it easy for you to debug your pipelines and collaborate with your teammates.
A Dagger Trace shows a detailed timeline for operations completed in a pipeline run. Dagger Cloud also applies unique IDs and icons for related operations, which are essential for debugging your pipeline when something does wrong.
Dagger Runs
The Runs view only applies to pipeline runs with Dagger versions older than 0.11.0.
To view your runs, navigate to the All Runs page of the Dagger Cloud dashboard. The All Runs page lists runs you've kicked off from your local development host and in CI. You should see your most recent run as the first entry in the table, as shown below:
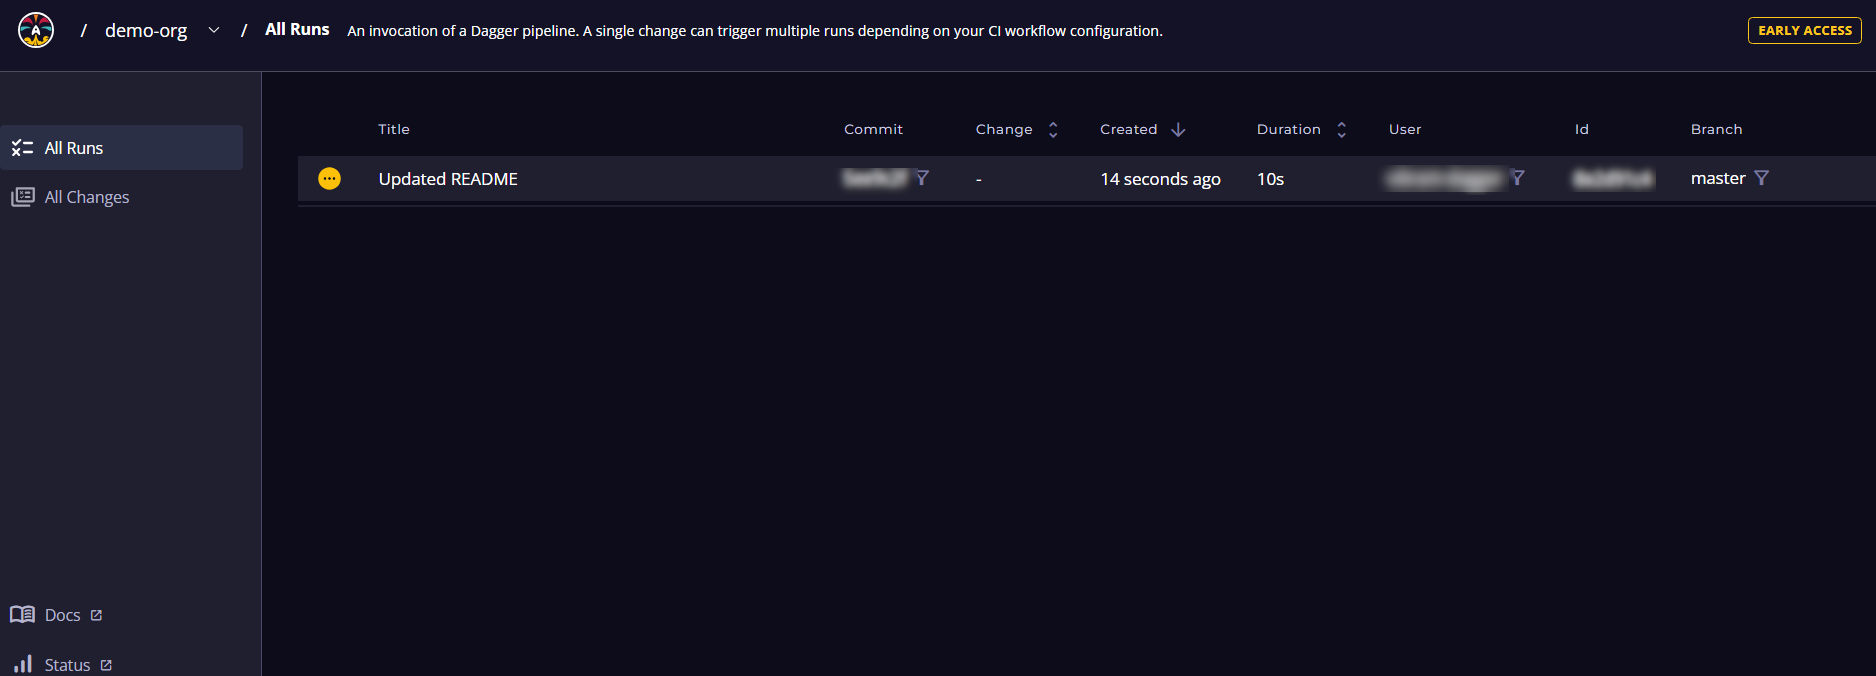
A run represents one invocation of a Dagger pipeline. It contains detailed information about the steps performed by the pipeline.
The All Runs page provides an overview of all runs. Here's a quick summary of what you'll see for each run.
| Field | Description |
|---|---|
| Status | Indication of run success or failure |
| Title | Title of the pull request or Change or commit title (abbreviated) |
| Commit | Git commit ID |
| Change | Reference to the pull request or merge request your in source code repository |
| Start | Run start time |
| Duration | Run duration |
| User | User triggering the run |
| Runner Job | Run ID (first 8 identifying bytes) |
| Branch | Name of the branch in source code repository |
| Remote | Full path to the remote source code repository |
You can display a subset of runs, such as runs related to a specific commit, branch, user or remote, by clicking the Filter icon in the corresponding field of the run list.
You can drill down into the details of a specific run by clicking it. This directs you to a run-specific Run Details page, as shown below. When you run Dagger locally, this is the page you visit when you click the Dagger Cloud link in the CLI output.
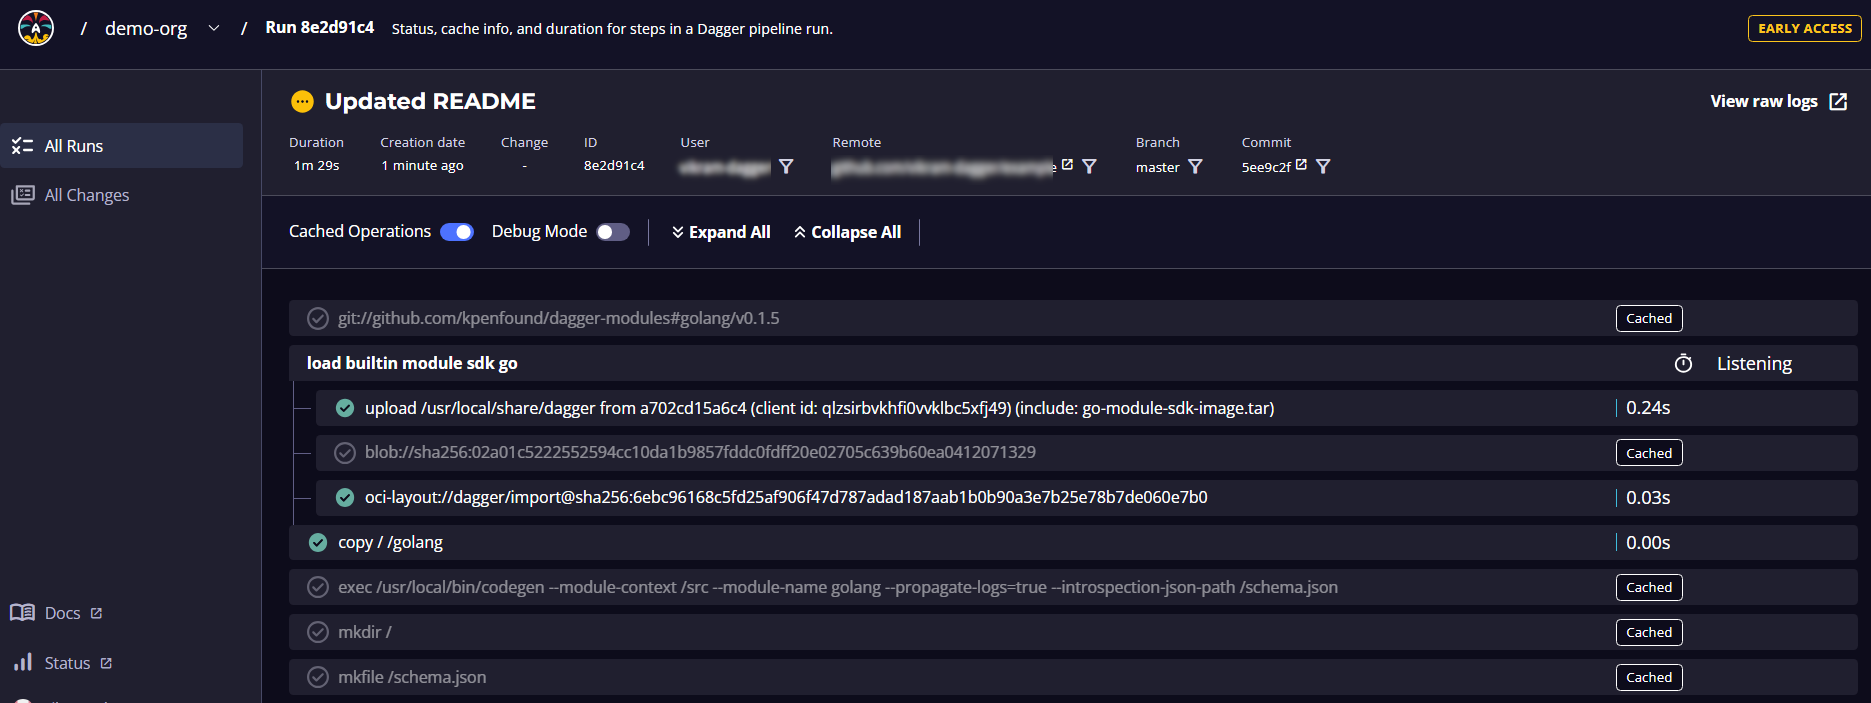
The Run Details page includes detailed status and duration metadata about the pipeline steps. The tree view shows Dagger pipelines and steps within those pipelines. If there are any errors in the run, Dagger Cloud automatically brings you to the first error in the list. You see detailed logs and output of each step, making it easy for you to debug your pipelines and collaborate with your teammates.
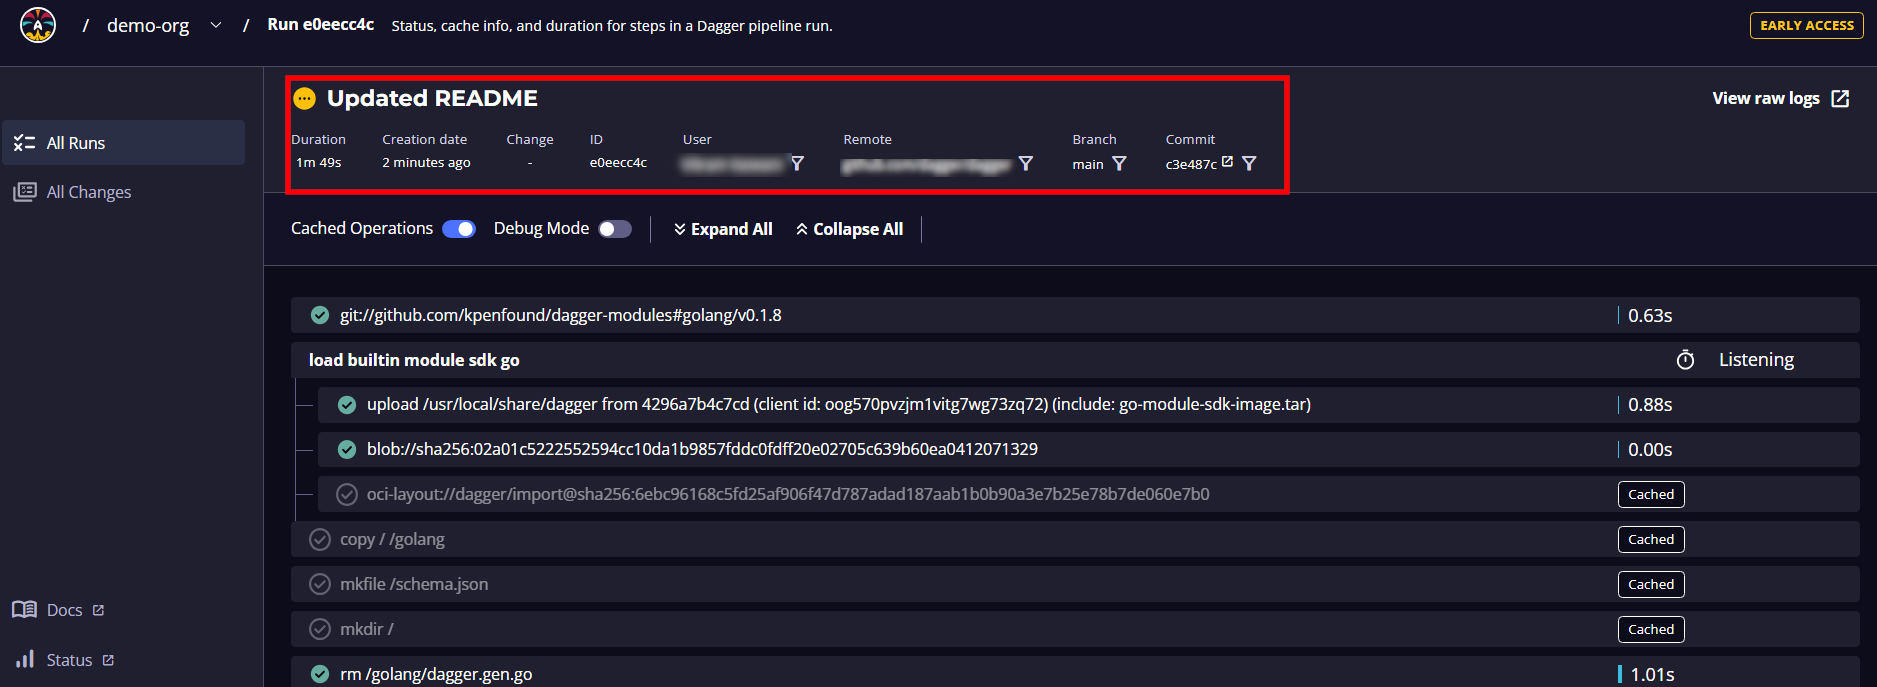
When the run is performed in a Git context, the Dagger Cloud UI shows the VCS Git metadata associated with the commit.
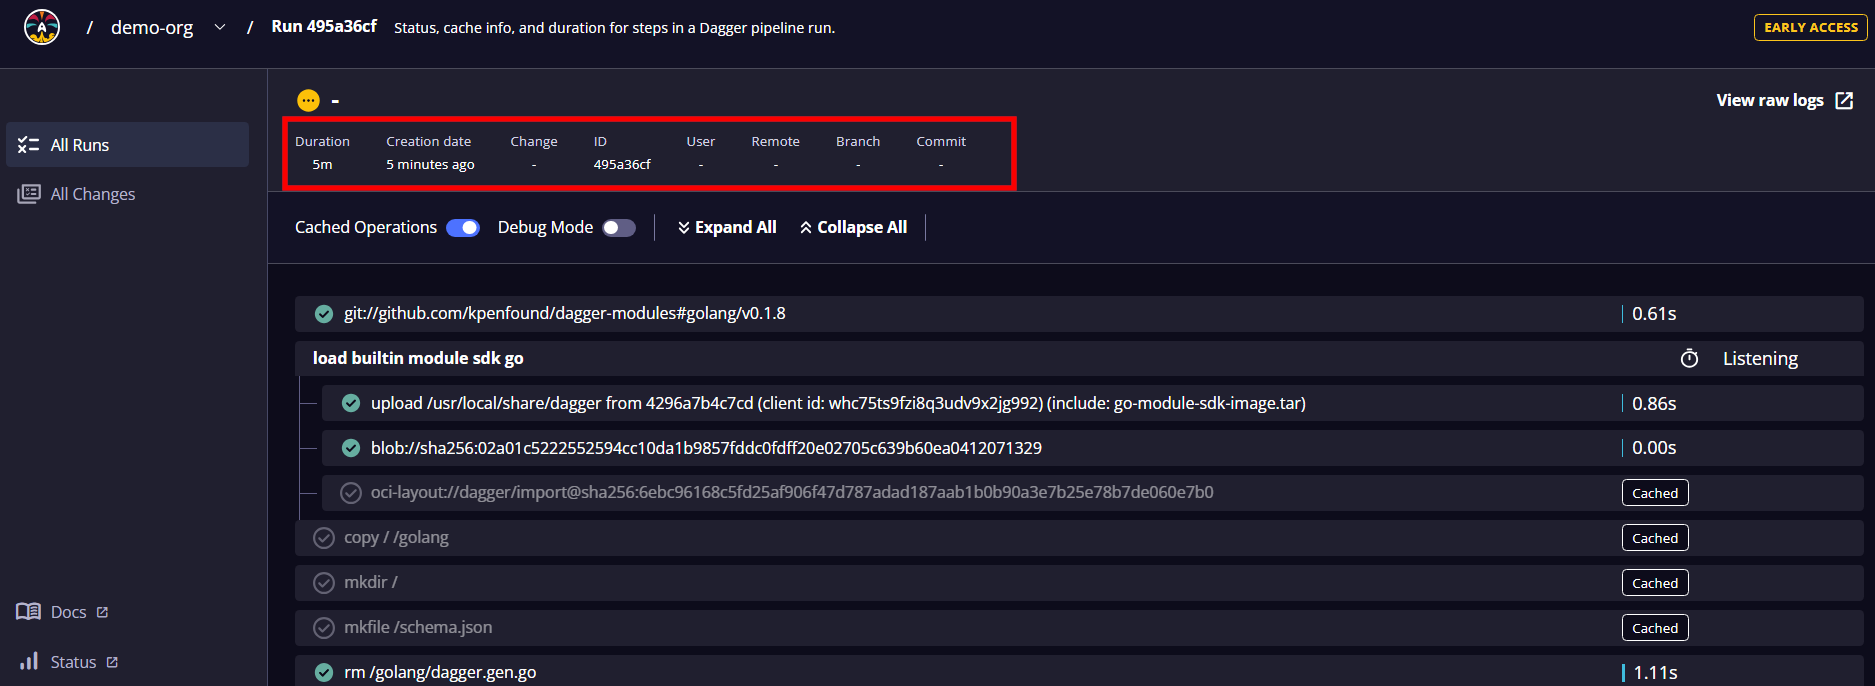
When the run takes place outside of a Git context, Dagger Cloud will show the same detailed steps. However, the top-level metadata will not be populated.
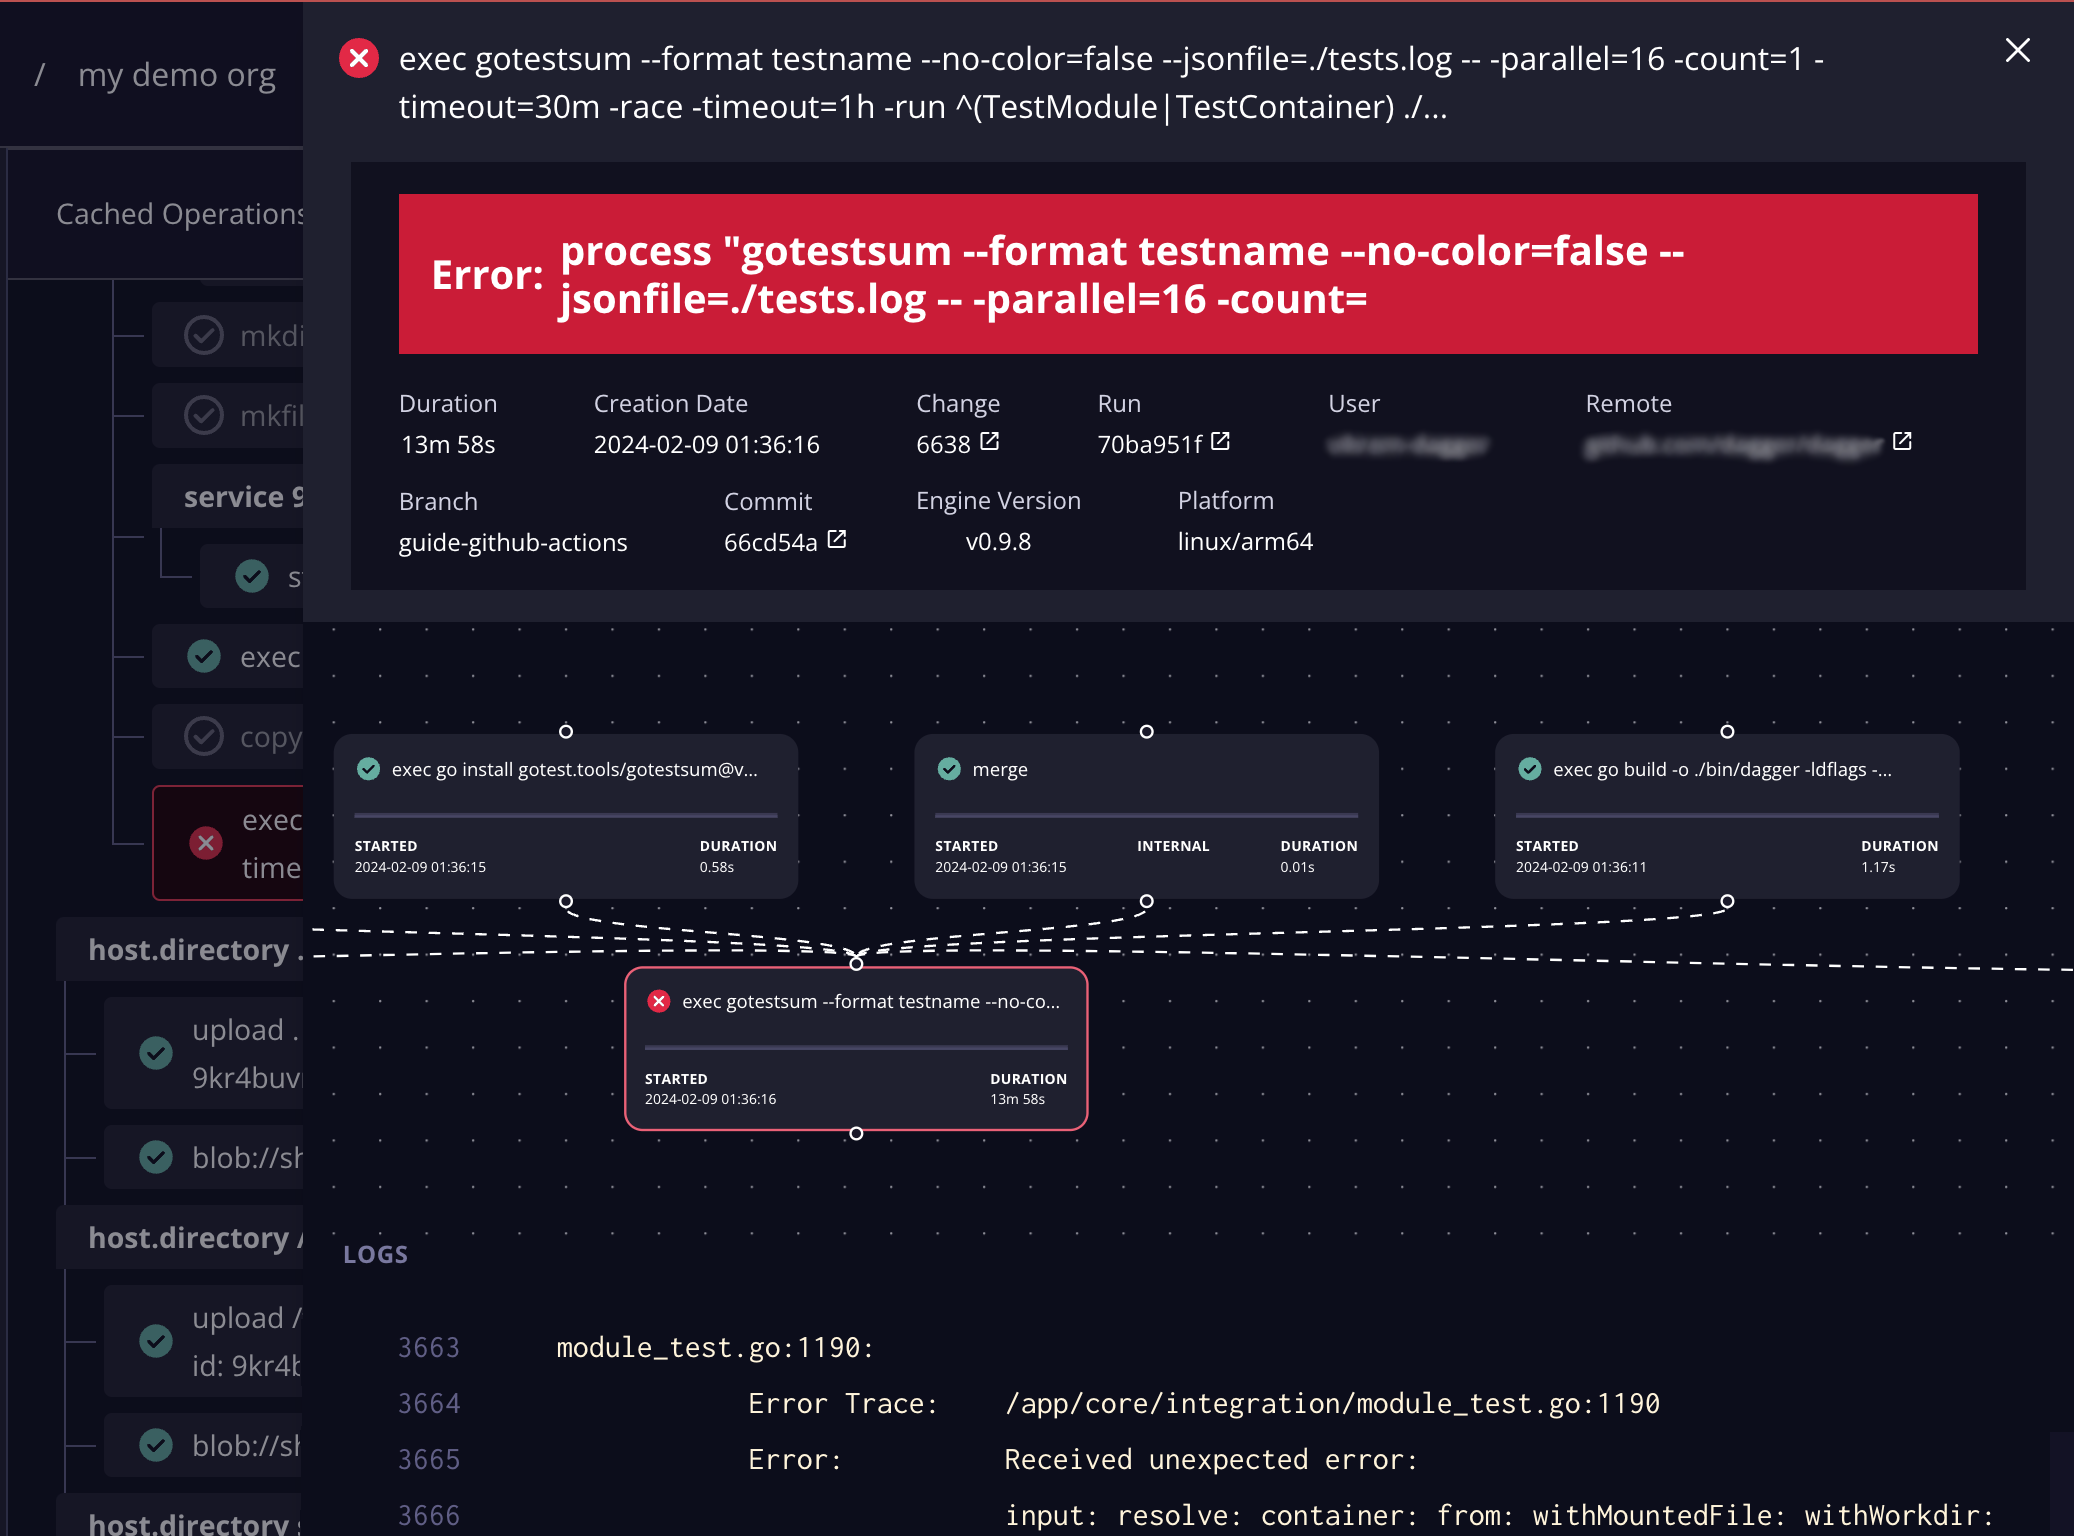
Clicking into a specific step will open a drawer with several elements that can help you debug why your pipeline is failing and help you identify why a step might not have been cached.
Changes
The Changes views only apply to pipeline runs done with Dagger versions older than 0.11.0. These views have been replaced by the new Traces views in Dagger Cloud.
A change is a group of runs for a specific commit or pull/merge request.
The All Changes page lists available groups.
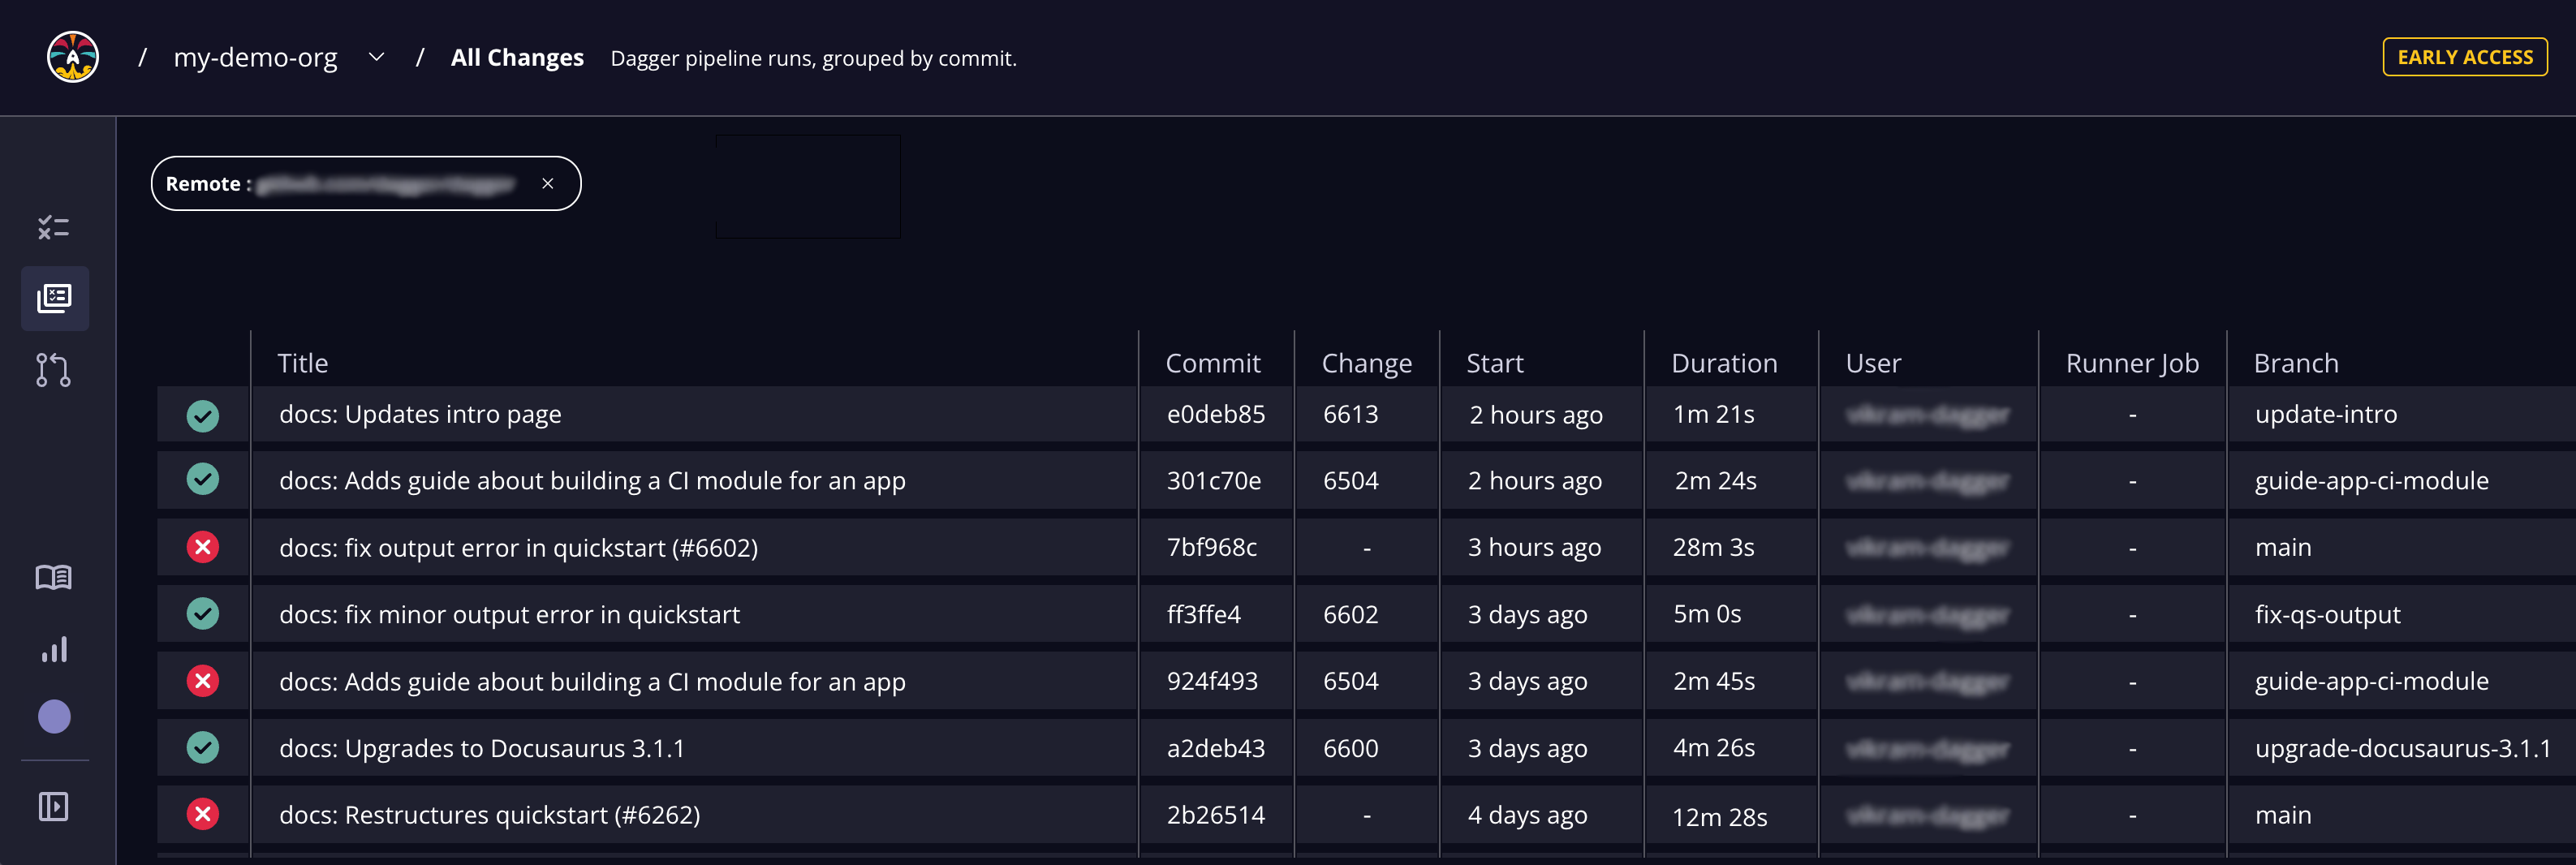
Here's a quick summary of what you'll see for each change.
| Field | Description |
|---|---|
| Status | Indication of run success or failure |
| Title | Change or commit title (abbreviated) |
| Commit | Commit ID |
| Change | Reference to change in source code repository |
| Start | Run start time |
| Duration | Run duration |
| User | User triggering the run |
| Runner Job | Run ID (first 8 identifying bytes) |
| Branch | Name of the branch in source code repository |
| Remote | Full path to the remote source code repository |
You can drill down into the details of a specific change by clicking it. This directs you to a Change Details page, as shown below:
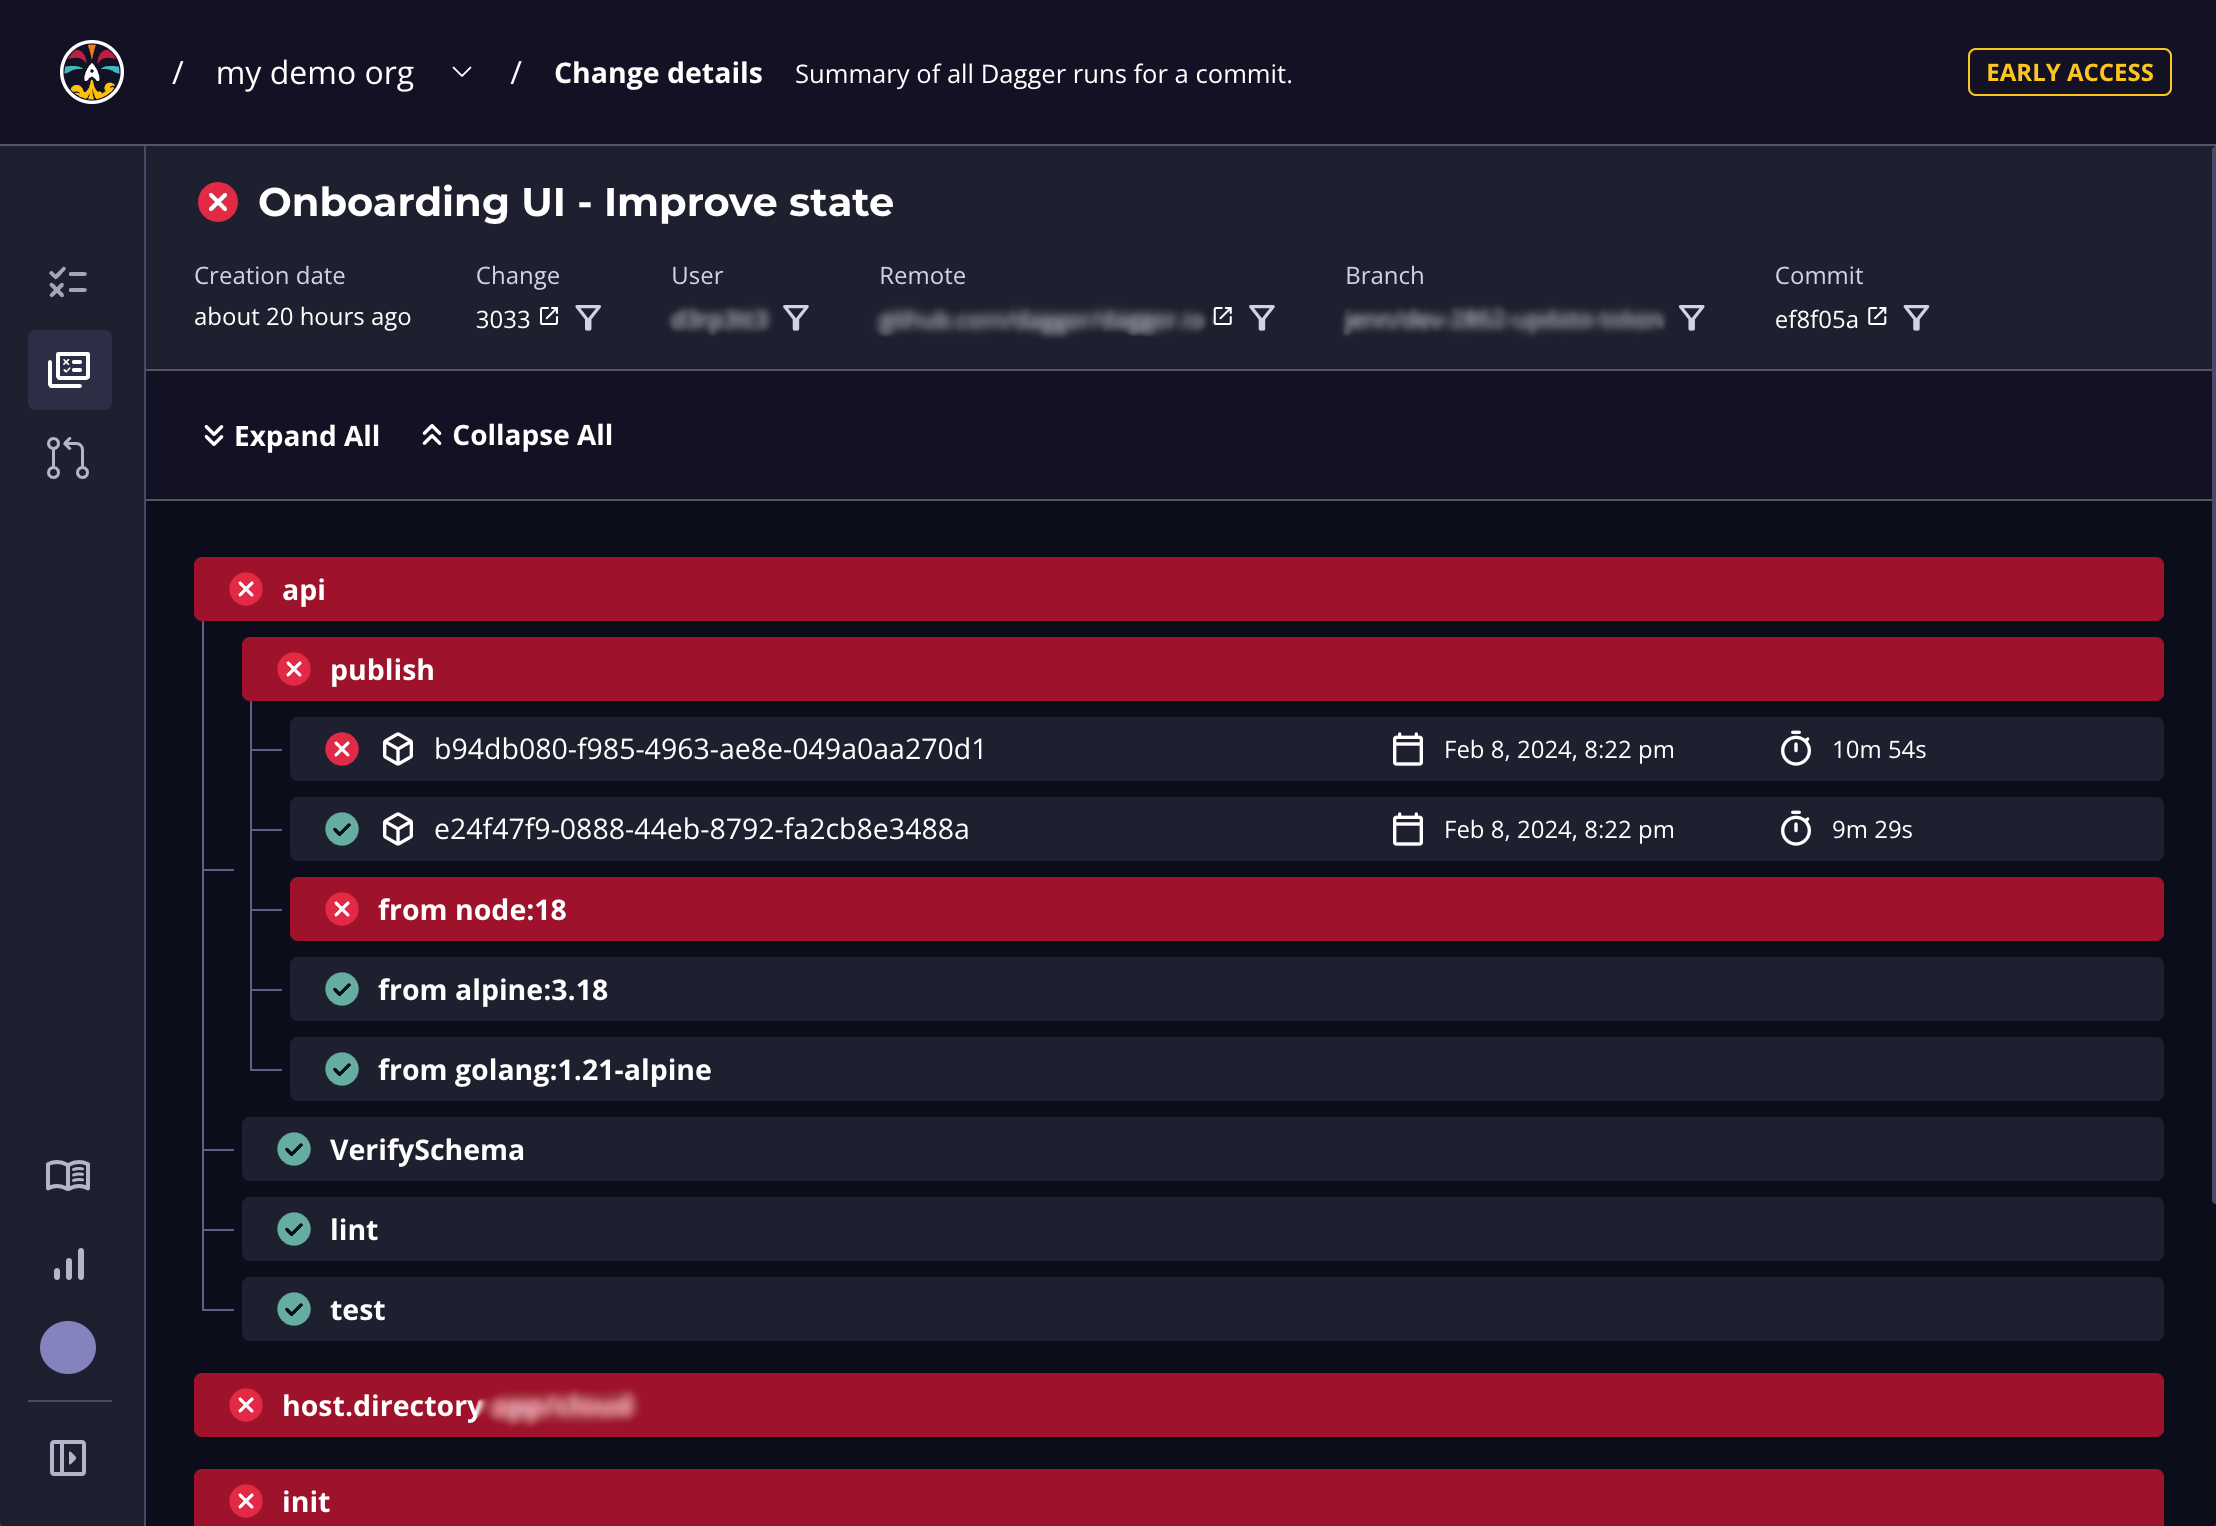
The Change Details page lists all the pipeline runs for the commit or pull request. The tree view shows Dagger pipelines and detailed logs of steps and outputs within those pipelines. Clicking into a run takes you to the run's details page.
Step 4: Use cache volumes with the experimental Dagger Cloud cache
At the end of this step, you will have integrated Dagger Cloud's experimental distributed cache with your workflows.
Dagger Cloud's distributed caching feature is only available under the Team plan.
One of Dagger's most powerful features is its ability to cache data across pipeline runs. This is especially useful when dealing with package managers such as npm, maven, pip and similar. For these tools to cache properly, they need their own cache data (usually a directory) to be persisted between runs. Since these dependencies are usually locked to specific versions in the application's manifest, re-downloading them on every pipeline run is inefficient and time-consuming.
Dagger comes with built-in support to define one or more such directories as cache volumes and persist their contents across runs. Dagger Cloud enhances caching support significantly and allows cross-host synchronization of cache volumes. This allows multiple machines, including ephemeral runners, to intelligently share a distributed cache.
Dagger Cloud automatically detects and creates cache volumes when they are declared in your code. The Go builder module used in this guide already declares two cache volumes, named gomodcache and gobuildcache. To see them in action, trigger your CI workflow by pushing a commit or opening a pull request.
If you've configured cache volumes for the first time in a local development environment, call your Dagger Module via the Dagger CLI and then run the command docker container stop -t 300 "$(docker container list --filter 'name=^dagger-engine-*' -q)". This step ensures your new cache volumes populate to Dagger Cloud as these are during the engine shutdown phase. You only need to do this the first time you use Dagger Cloud locally with cache volumes or when you add new cache volumes in your Dagger pipeline.
To see your cache volumes, browse to the Organization Settings page of Dagger Cloud dashboard (accessible by clicking your user profile icon in the Dagger Cloud interface) and navigate to the Configuration tab. You should see the newly-created volumes listed and enabled.
Your cache volumes will appear in the UI within a few minutes after your pipeline run has completed. If you don't see them in the UI, ensure you've referenced the volumes correctly in your Dagger Module code and that you've set up your CI or local development workflows to push the cache volumes to Dagger Cloud.
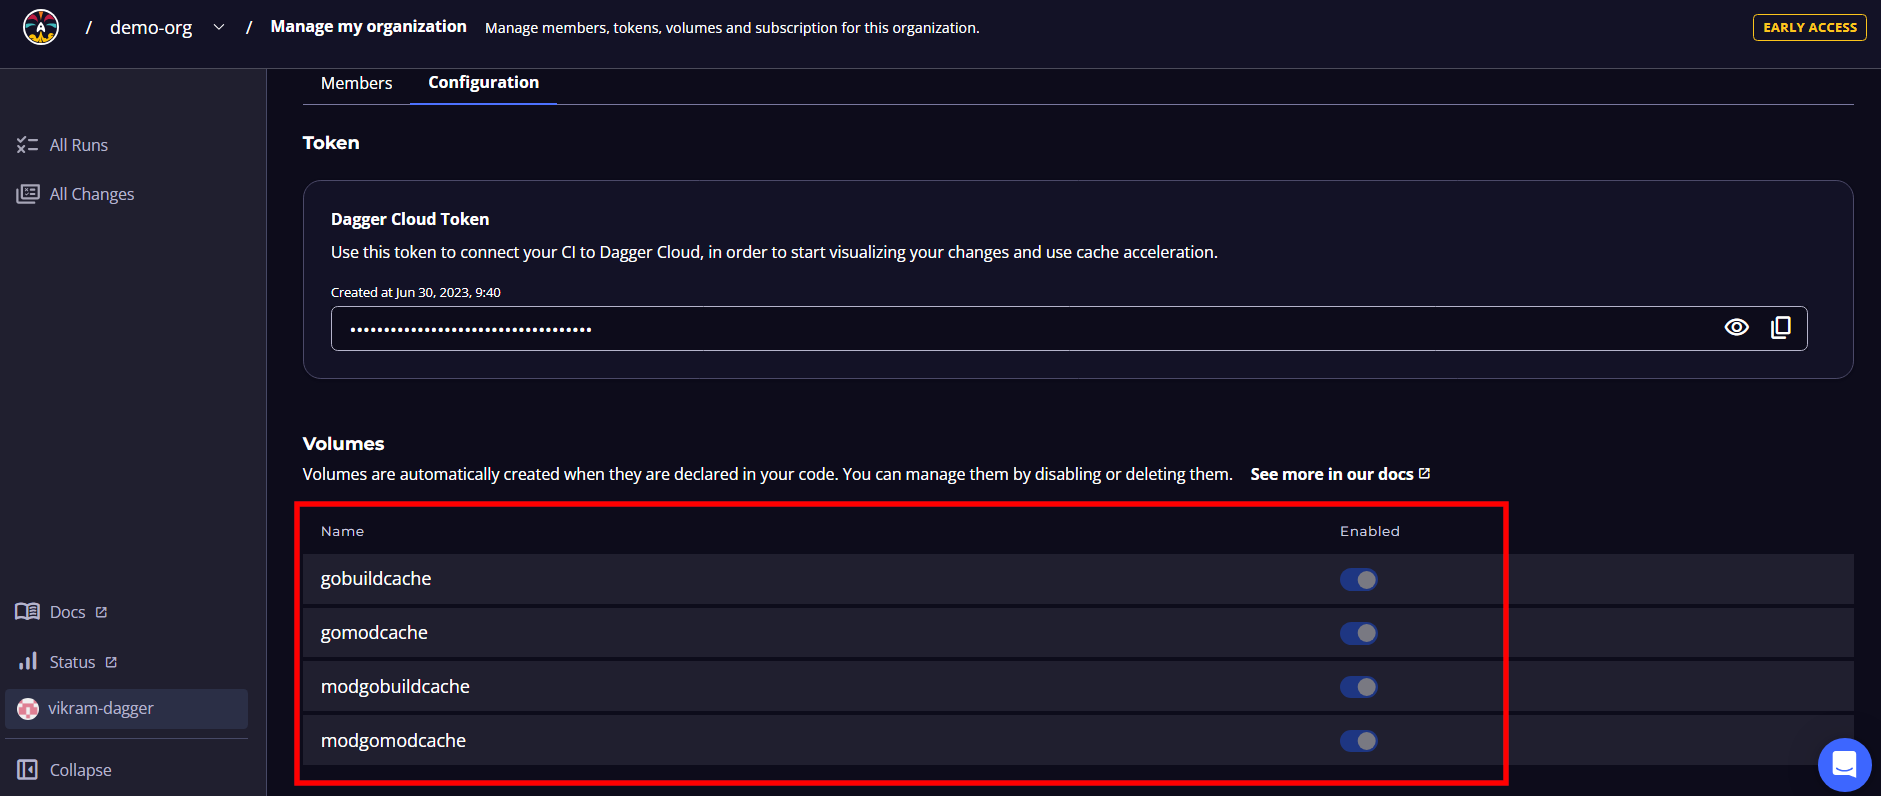
You can create as many volumes as needed and manage them from the Configuration tab of your Dagger Cloud organization page.
Conclusion
This guide introduced you to Dagger Cloud and walked you through registering a new organization, integrating Dagger Cloud with your CI provider/tool, and using Dagger Cloud's visualization and caching features. For more information and technical support, contact Dagger via the support messenger in Dagger Cloud.